IntensityView

Photometric data inspection, editing, and reporting

Open, compare, modify, and document luminous intensity distributions in the formats lighting engineers use every day.
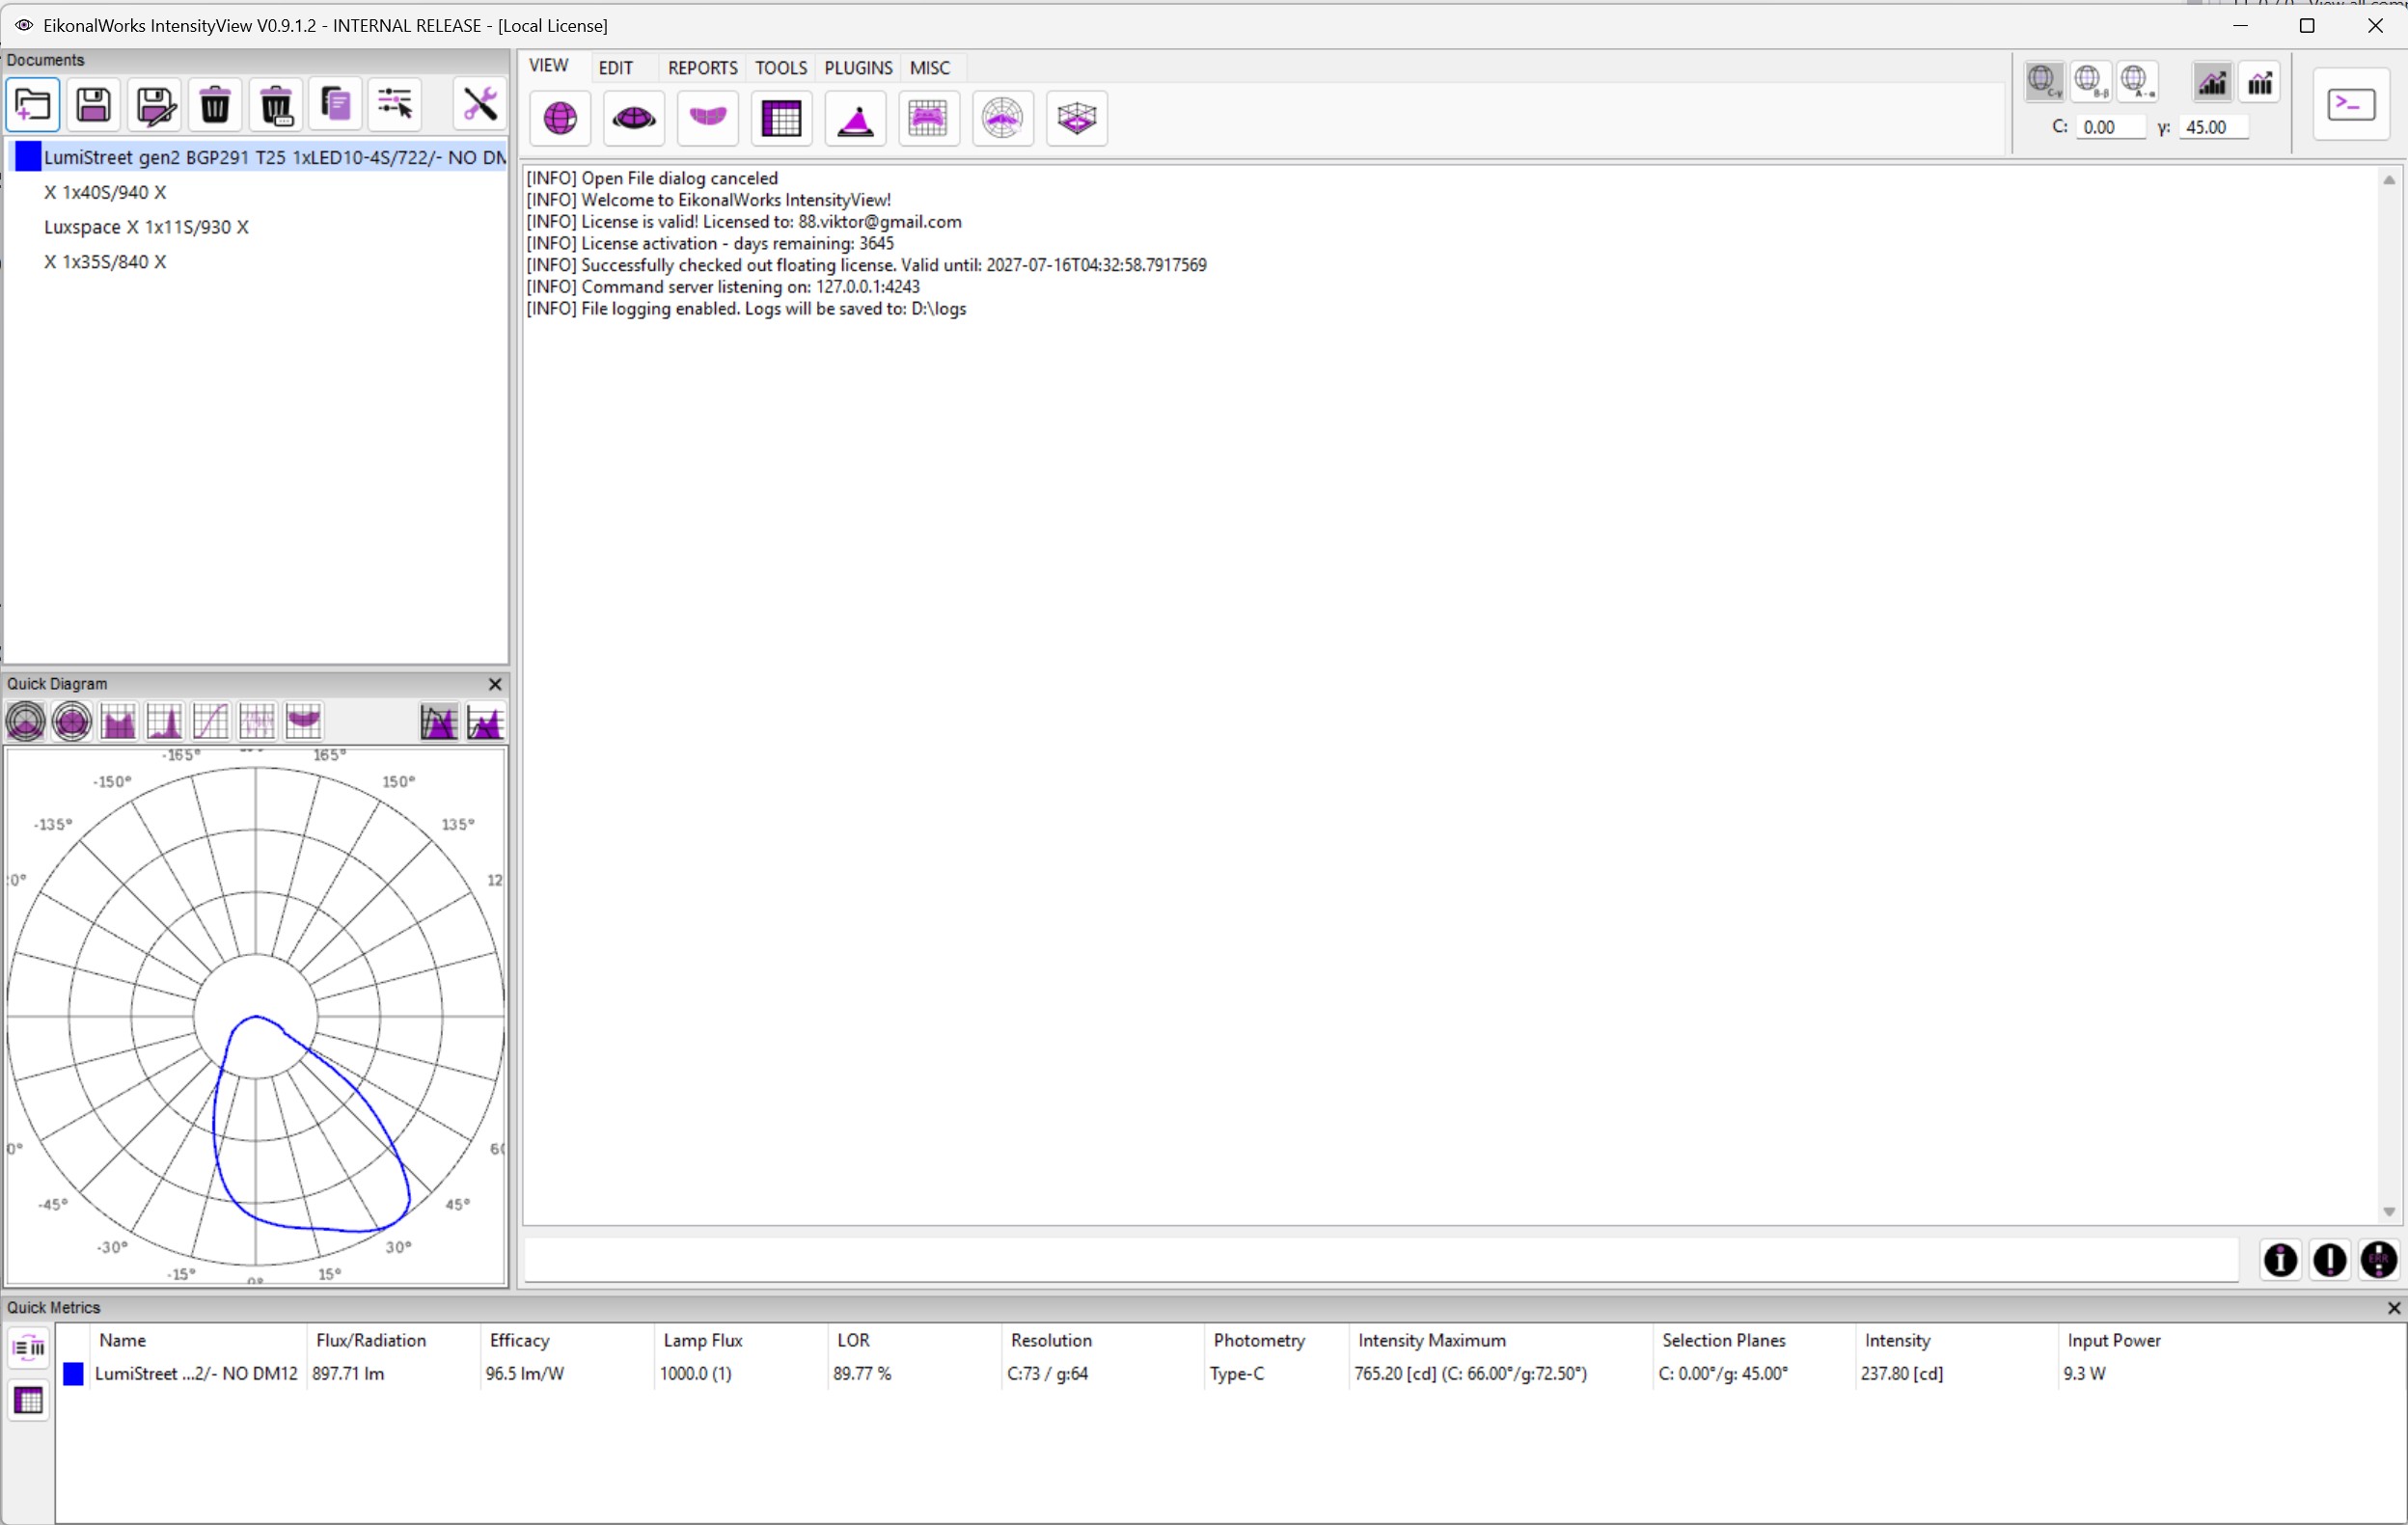
IntensityView user interface

Import

Open common photometric exchange formats and preserve richer EikonalWorks data.

Inspect

Review distributions in 3D, maps, tables, contours, diagrams, and rendered views.

Edit

Adjust metadata, geometry, symmetry, smoothing, alignment, scale, and combined results.

Report

Prepare roadway, glare, beam, luminance, utilization, color, and related outputs.

Overview

Built around engineering photometry workflows

IntensityView is a photometric data application for opening, inspecting, editing, comparing, and reporting luminous intensity distributions. It is designed for lighting engineers, optical designers, and product teams working with measured or simulated luminaire data.

The workspace focuses on the practical tasks around intensity files: import and export, view-based inspection, false-color visualization, photometric modification tools, roadway and indoor calculation reports, colorimetric reports, and quick metrics for selected luminaires.

IES
EULUMDAT
TM-33
GLDF
PHILLUM
TM-14
.EWI
Intensity distribution analysis
View modes

Inspect distributions from every useful angle

Switch between visual, numeric, and projected views to understand beam shape, angular data, selected sections, and rendered illumination behavior.

Sphere View

Display selected distributions on a photometric sphere for beam shape, symmetry, color data, and focused C/gamma direction checks.

3D View

Inspect the luminous intensity distribution as a spatial shape and compare selected distributions in different rendering modes.

2D Map View

Analyze the angular distribution as a false-color map with cartesian and projection-style views for dense visual inspection.

Table View

Review selected photometry as precise numeric table data for detailed inspection, copying, and supported edits.

Illuminance View

Calculate and plot illuminance on a selected projection plane to compare beam behavior at a specified distance.

Isocandela View

Show equal-intensity contours to inspect beam spread, peak intensity, and contour shape.

Polar and Cartesian Diagram

Plot selected photometric sections as 2D curves for comparing planar sections, conic sections, and peak-direction behavior.

Rendered Illuminance View

Render apparent illumination and color appearance on a projection plane for visual surface inspection.

Edit modes

Prepare and correct photometry without leaving the workspace

Use structured editors for metadata, geometry, resolution, alignment, smoothing, scaling, combination, and packaged multi-emitter photometry.

Properties

Edit core photometric quantities across selected intensity distributions, including batch edits when multiple photometries are selected.

Property Fields

Manage structured luminaire and intensity metadata for file-format, report, manufacturer, lamp, optical, and regulatory fields.

Photometry Type and Resolution

Change coordinate type, symmetry, and angular resolution while previewing the resulting data structure.

Geometry Editor

Edit luminaire body geometry and emitter geometry with a live 3D preview for selected photometry.

Rotation

Rotate selected distributions and compare before/after data before applying the update.

Symmetrize

Apply symmetry to selected intensity distributions with a preview of the resulting photometric data.

Automatic Alignment

Correct small goniophotometer mounting and orientation errors by searching for a rotation that better matches expected symmetry.

Smoothing and Denoising

Reduce measurement noise with Gaussian smoothing while preserving the overall photometric shape.

Scale

Widen or compress selected distributions independently along horizontal axes for controlled beam-shape correction.

Combine

Create a combined photometry from selected distributions for multi-emitter or lens-variant workflows.

Photometry Packaging Builder

Manage photometries inside multi-emitter documents for modern luminaire and BIM-oriented formats.

Reports

Turn selected photometry into engineering outputs

Generate indoor, roadway, glare, beam, luminance, color, utilization, uniformity, zonal lumen, and classification reports directly from selected distributions.

UGR Table

Estimate Unified Glare Rating values for selected luminaires using luminaire luminance, position, solid angle, background luminance, and Guth position index.

UGR Chart

Plot luminaire luminance against observation angle and overlay UGR limit curves for quick glare assessment.

Soellner Diagram

Compare selected luminaire luminance curves against glare limitation curves with immediately updating limit classes.

Luminance Table

Calculate luminaire luminance for selected photometries and present it as tabular angular data.

Utilization Factor Table

Report how effectively the selected luminaire sends luminous flux to a reference working area for standard room and spacing cases.

Uniformity Table

Estimate illuminance uniformity for standard spacing cases to assess regular-grid working plane layouts.

Zonal Lumen Table

Summarize emitted luminous flux by angular zones, including gamma bands and upper/lower hemisphere groupings.

Beam Spread

Calculate angular beam width values for luminaires whose useful output is described by one or more spread measurements.

Luminaire Classification System

Summarize outdoor luminaire flux by standard angular zones for uplight, glare, forward-light, and backlight classification.

IES Roadway Report

Review roadway lighting classification and evaluation data for selected intensity distributions in roadway-style applications.

Roadway Applicability

Search standard roadway arrangements and show where selected distributions may meet roadway class requirements.

Color Plot

Inspect chromaticity variation over selected luminous intensity distributions from measured or calculated color sample points.

Tools

Dedicated tools for modification and roadway workflows

Target detailed intensity edits, build roadway scenarios, calculate lighting criteria, generate candidate photometry, and search optimized arrangements.

Photometry Modification Tool

Select areas on a 2D angular map, then paint, fill, clone, transform, scale, add, or erase intensity and color values.

Roadway Editor

Create and edit roadway lighting scenarios used by the calculator, generator, and optimizer.

Roadway Calculator

Evaluate selected intensity distributions against roadway scenarios for luminance, illuminance, uniformity, and glare-related criteria.

Roadway Generator

Create idealized luminous intensity distributions for selected roadway scenarios with candidate scoring.

Roadway Optimizer

Search combinations of existing distributions and arrangement parameters to find the best passing roadway setup.