2D Map View
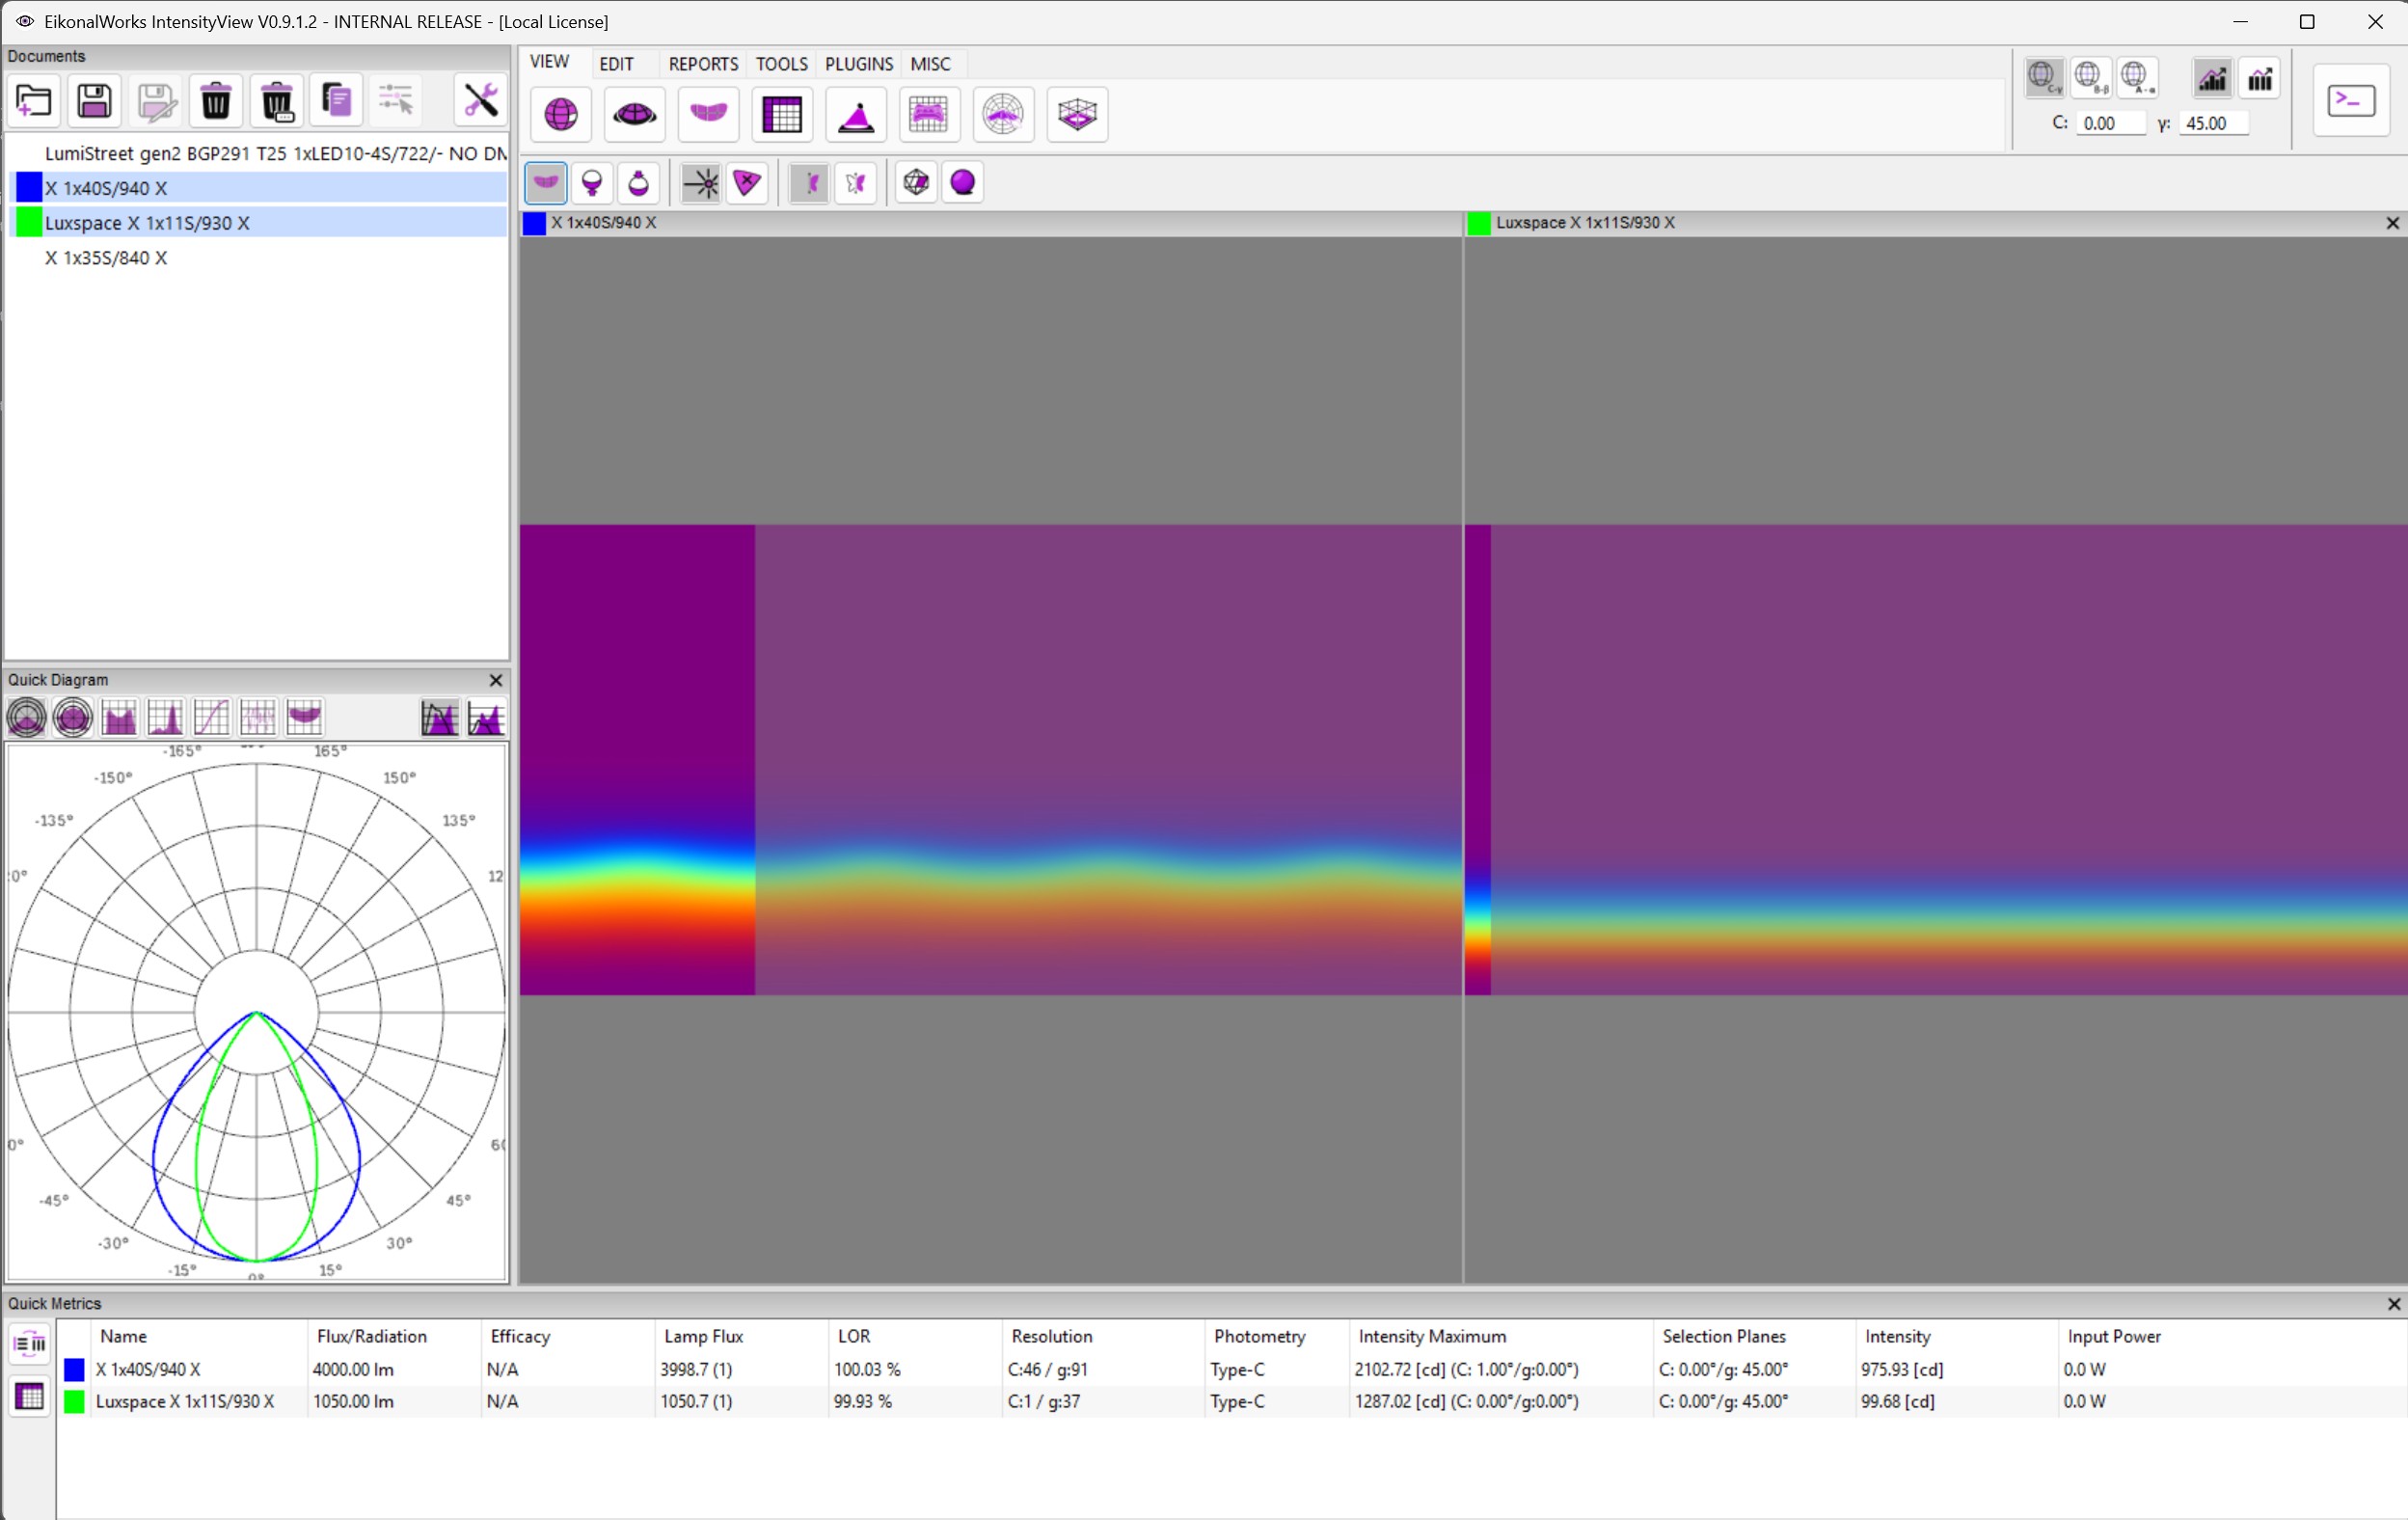
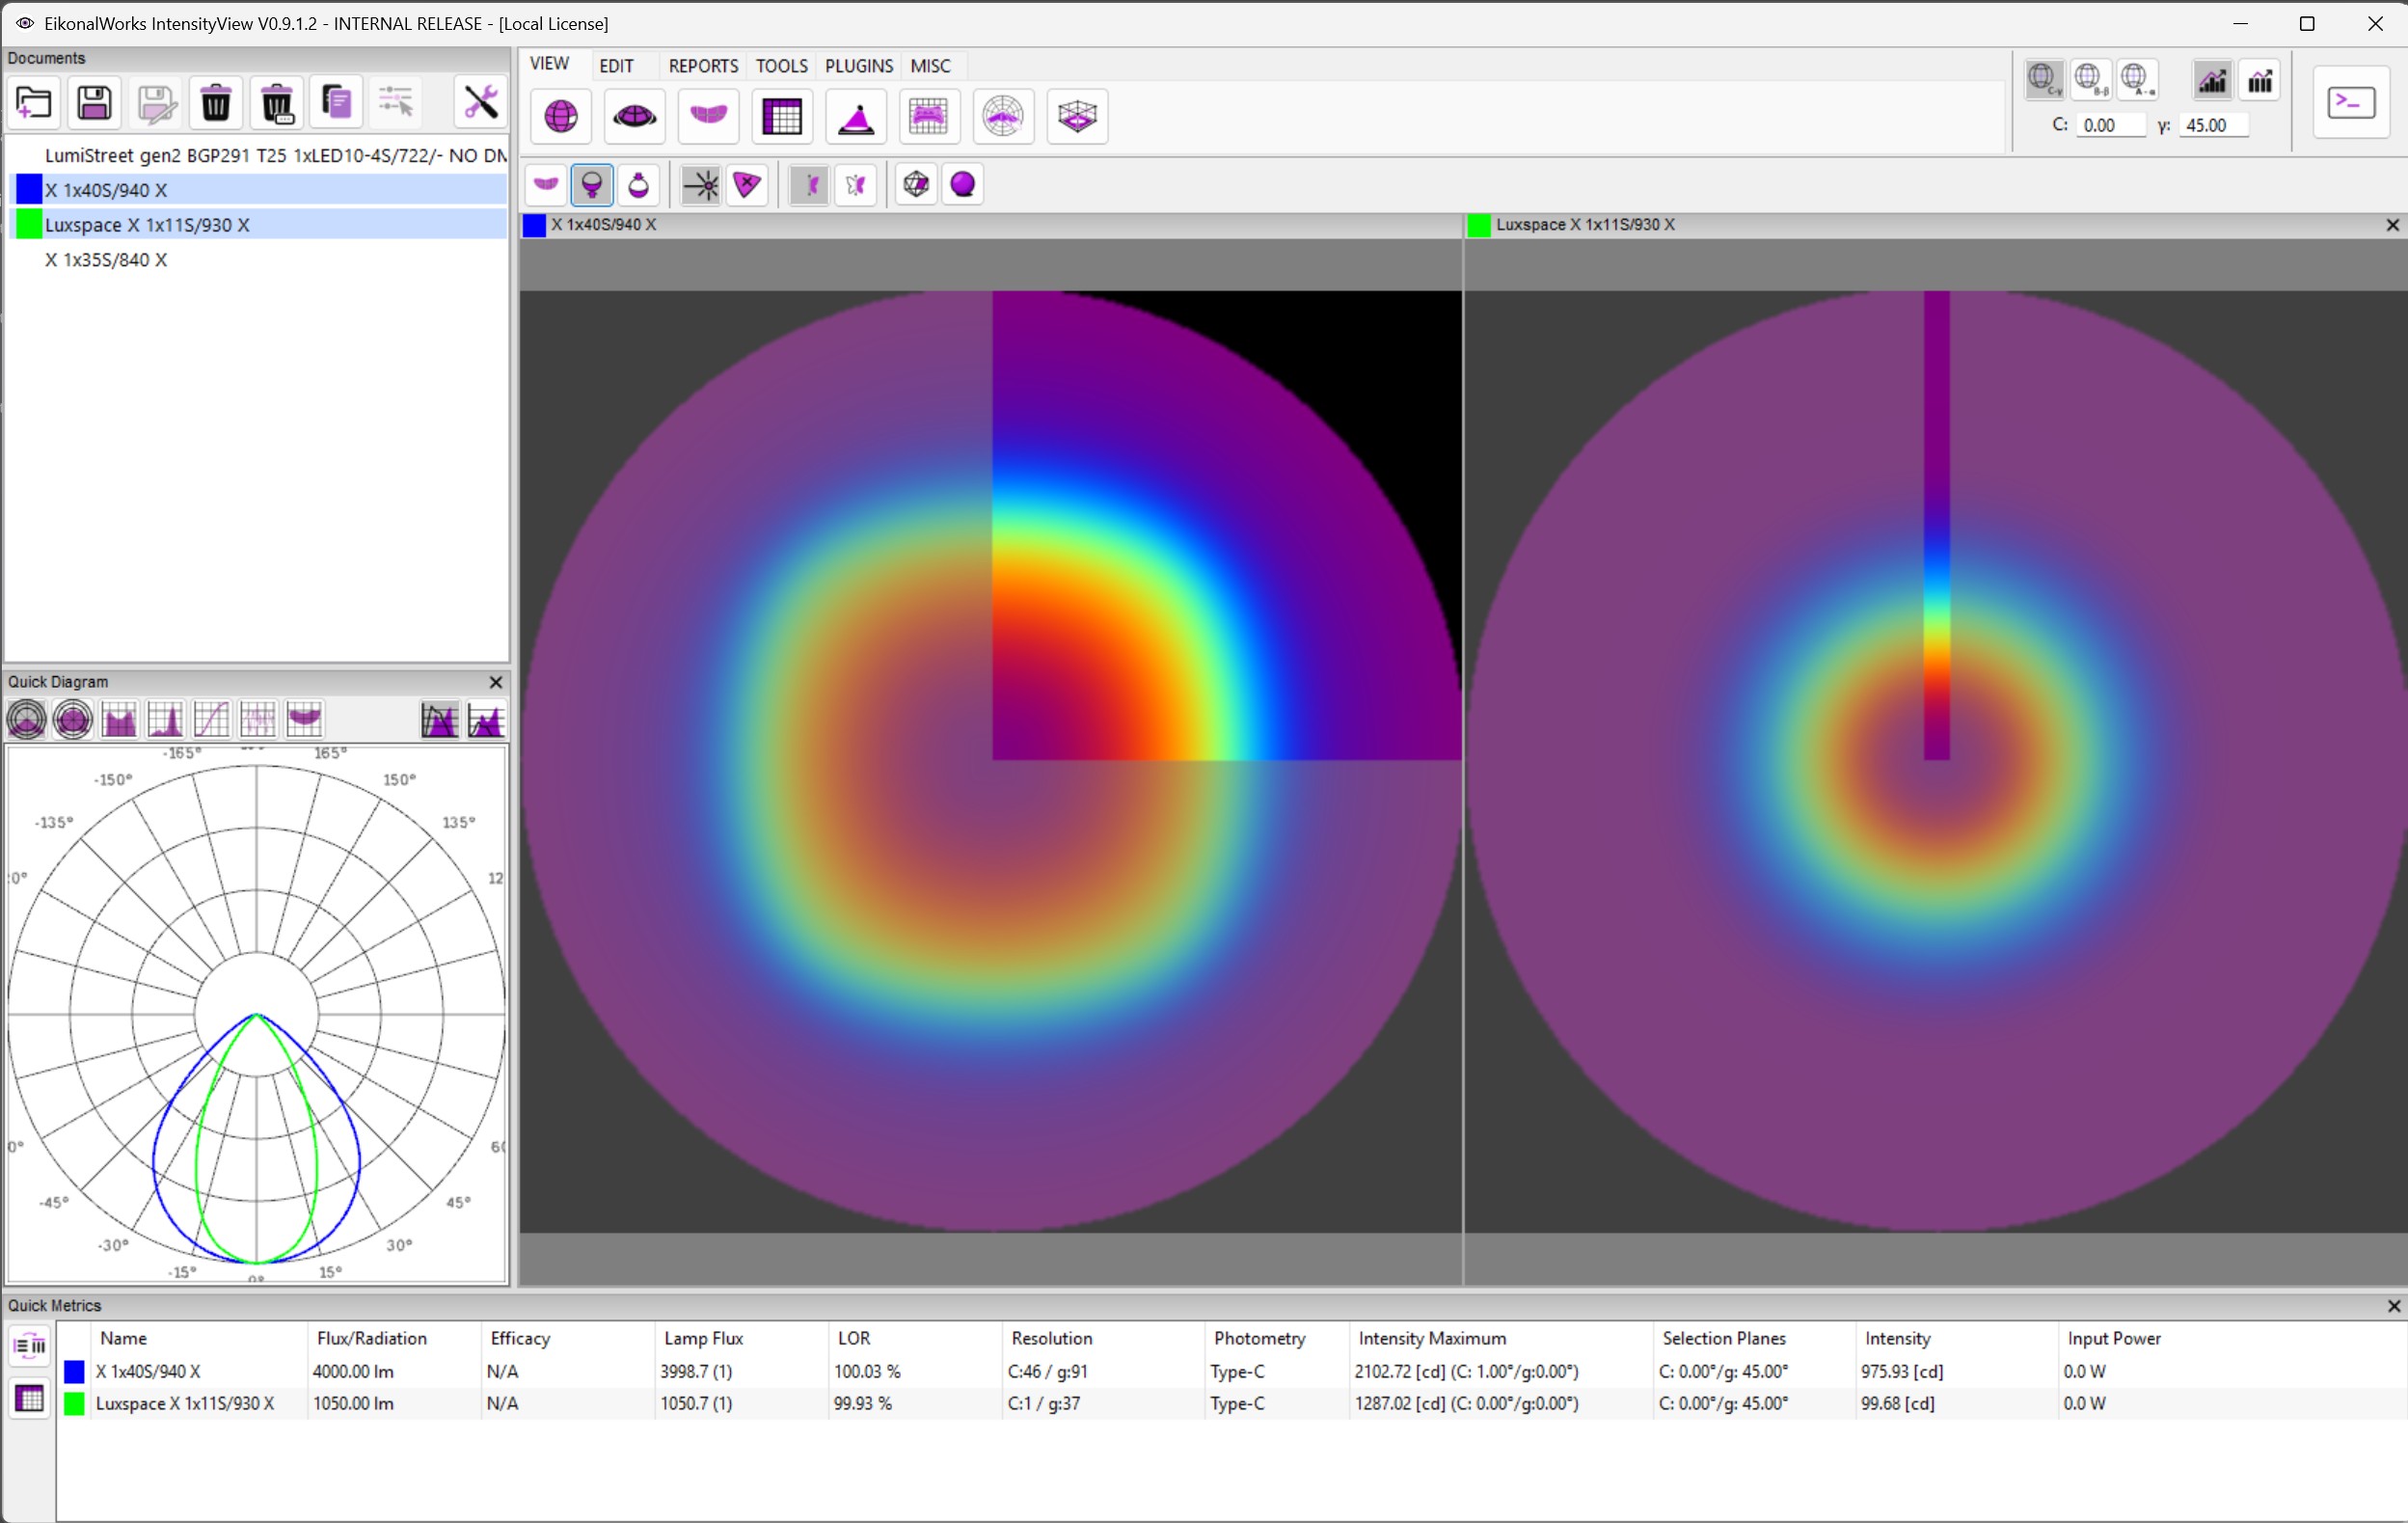
The 2D Map View displays selected intensity distributions as flat maps. It is useful when exact angular positions are easier to inspect on a plane than on a 3D shape.
Projection Mode
- Cartesian Projection: maps C/gamma values directly to a rectangular coordinate system. Point selection is available in this mode.
- Azimuthal Atlas Projection (Bottom): projects the lower hemisphere into an atlas-style map centered on the bottom direction.
- Azimuthal Atlas Projection (Top): projects the upper hemisphere into an atlas-style map centered on the top direction.
Display Mode
- Luminous Intensity: shows intensity values with the active false-color scale.
- True Color: shows color data when the selected intensity distribution contains color information.
Symmetry Display
- Symmetry Overlay: shows the source data with the symmetry coverage overlay.
- Clear Display: shows the display without the symmetry overlay.
Resolution
- By Mesh Definition: displays the original sampled points.
- Smooth: displays an interpolated smooth map.
Focus Selection
In Cartesian projection, clicking a map point updates the selected focus direction. Atlas projection modes are intended for inspection and do not use the same direct point-selection behavior.