Isocandela View
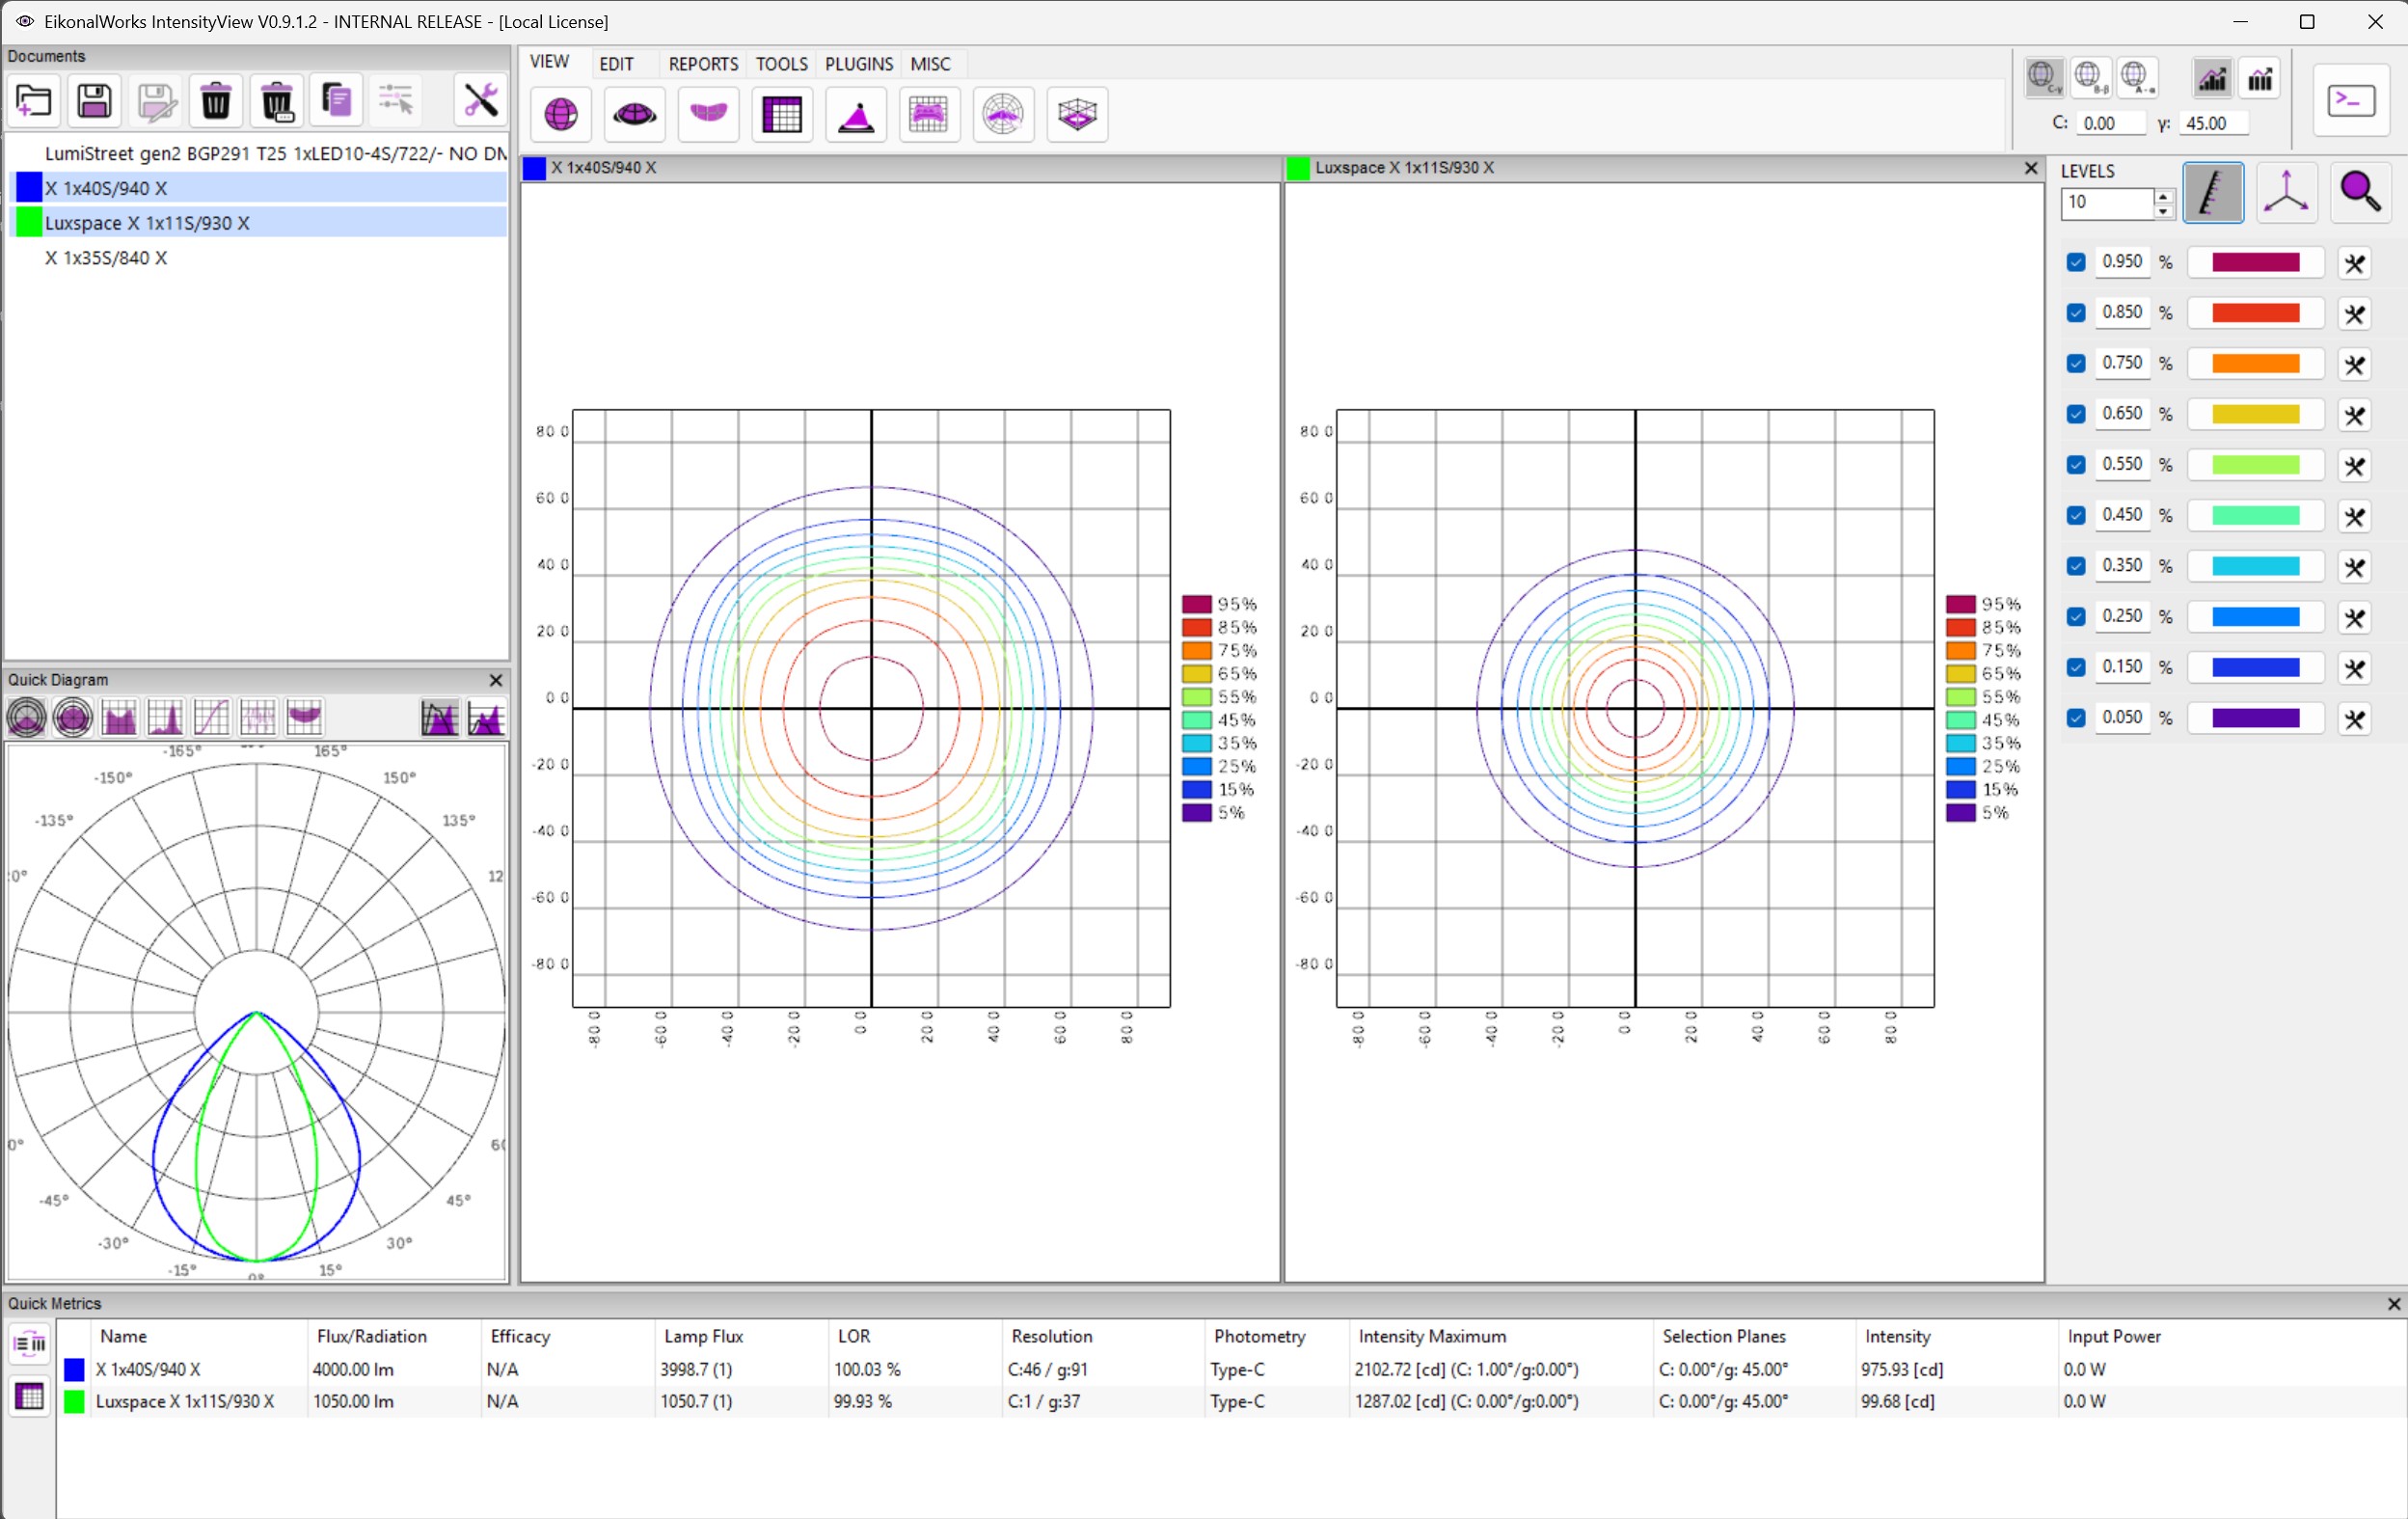
The Isocandela View displays equal-intensity contours over the photometric distribution. It is useful for inspecting beam spread, peak intensity, and contour shape.
Levels
LEVELS defines how many isocandela contour levels are generated. Higher values provide more detail but can make the plot denser.
Legend
The legend button toggles display of the contour level legend on the chart.
Imax Marker
The Imax button toggles the marker for the maximum intensity point.
Fit Range
The fit button adjusts the visible chart range to fit the active isocandela content.
Level List
The level list contains the generated contour levels and their visual settings. Changes are applied to all displayed isocandela charts.
Focus Selection
Clicking the chart updates the shared selected focus point using the chart position and the current photometric coordinate system.