Table View
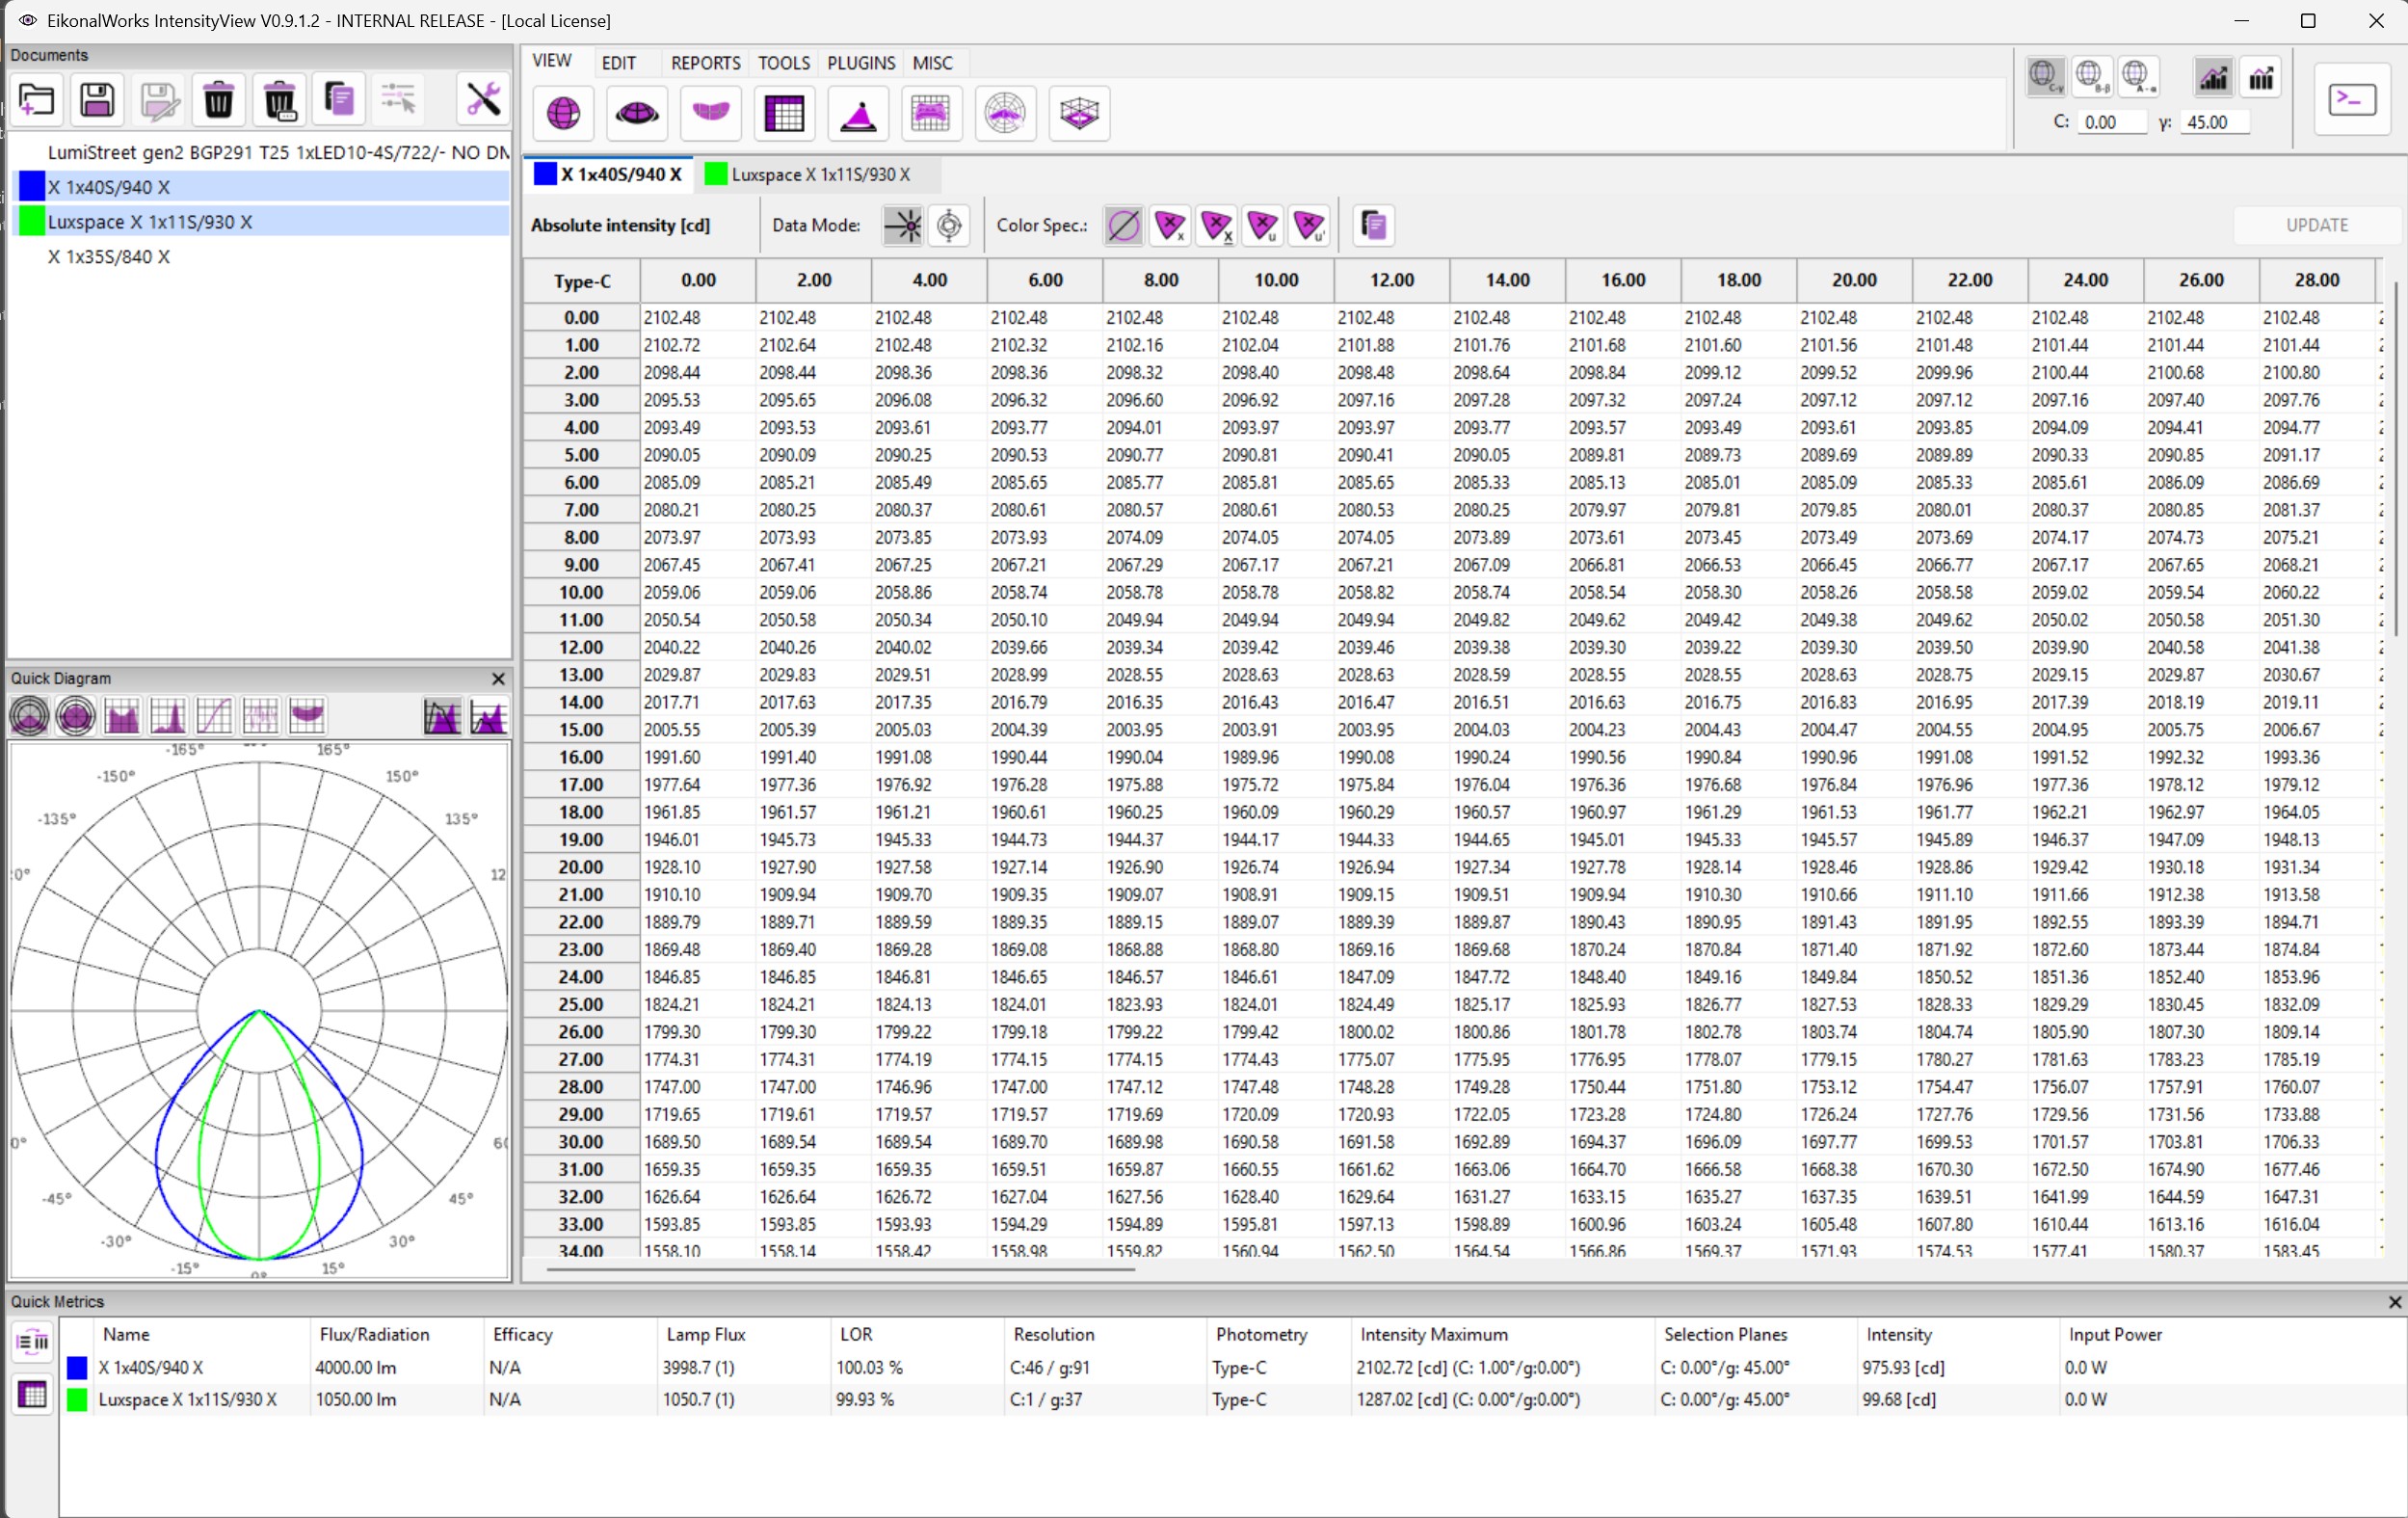
The Table View shows the selected intensity distribution as a numeric photometric table. It is intended for precise inspection, copying, and editing supported table data.
Data Mode
The Data Mode selector switches the table between available data layers, such as luminous intensity and available color-related data. Modes that are not present in the loaded file are disabled.
Color Specification
The Color Spec. selector controls which color representation is shown when color data is available. Supported options include no color definition, tristimulus XYZ, CIE 1931 xy, CIE 1960 uv, and CIE 1976 u'v'.
Copy
The copy button copies the selected table cells to the clipboard for use in spreadsheets, reports, or external calculations.
Update
The UPDATE button becomes enabled when editable table values have been changed. Pressing it commits the working table values back to the intensity data.
Focus Selection
Selecting table cells updates the shared focus point using the selected row and column headers. The table uses the current photometric coordinate system for the conversion.