Polar And Cartesian Diagram View
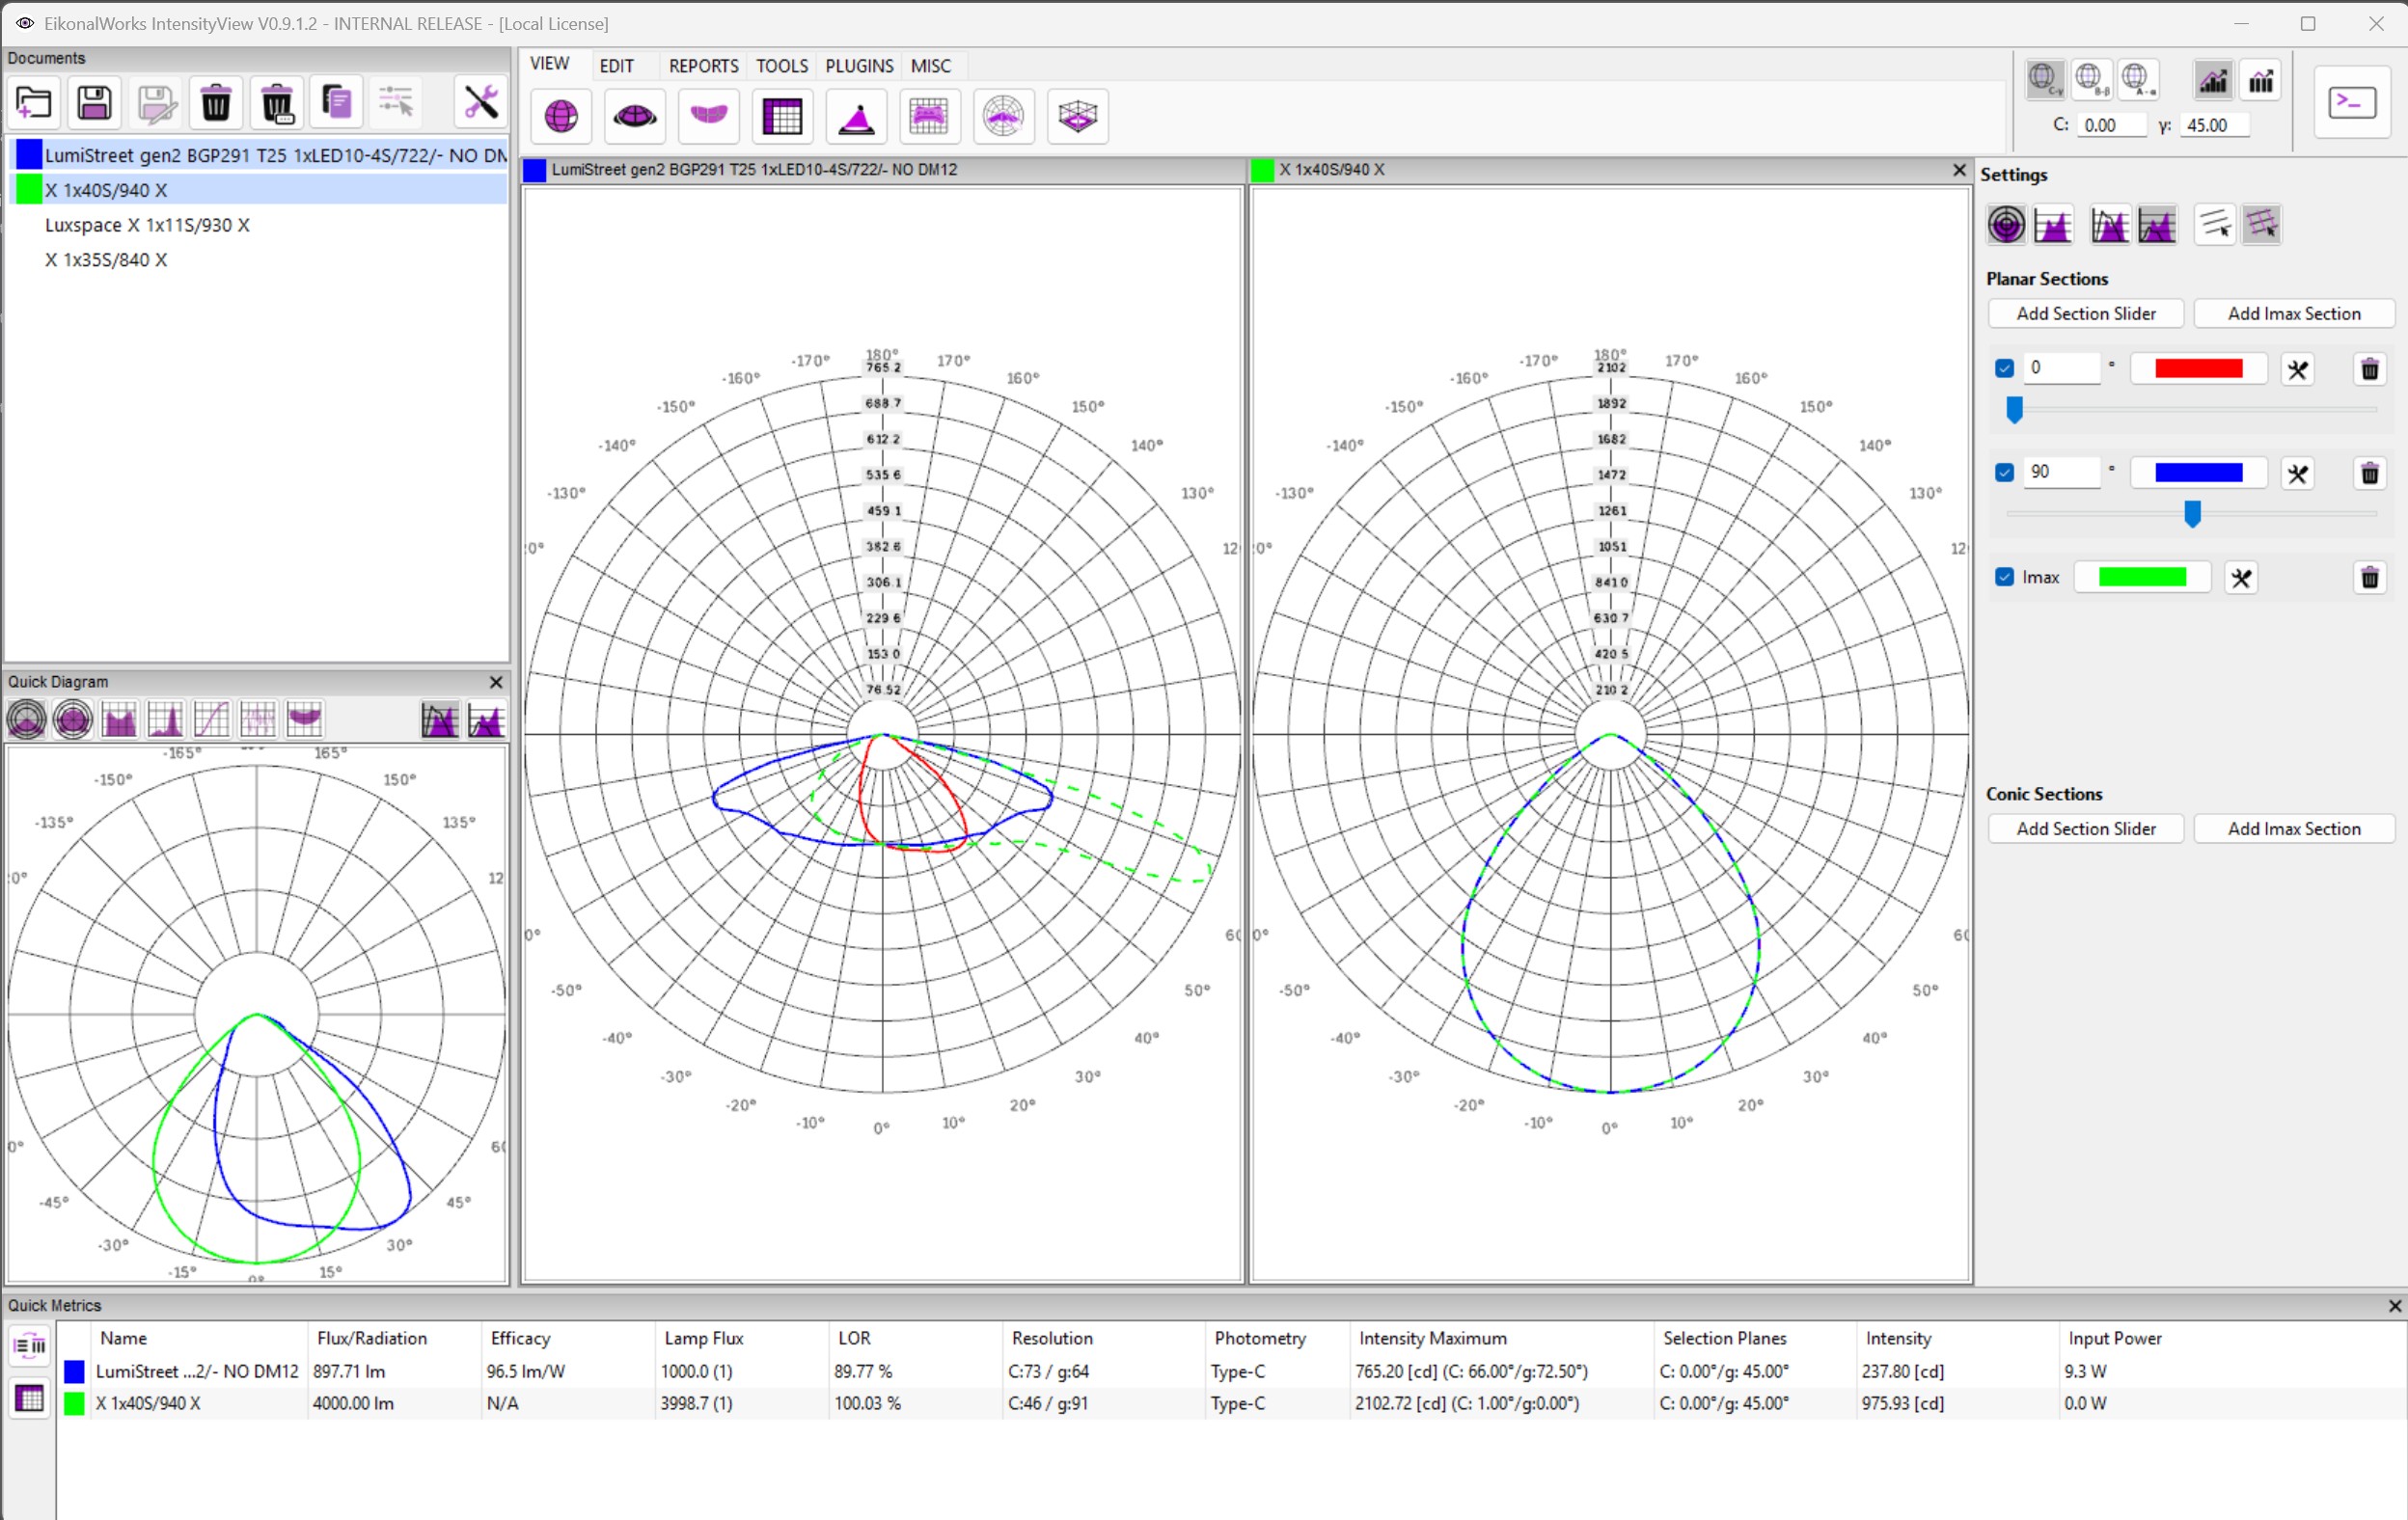
The Polar and Cartesian Diagram View plots selected photometric sections as 2D curves. It is useful for comparing planar sections, conic sections, and peak-direction behavior.
Chart Type
- Polar Plot: draws values radially around the selected section angle.
- Cartesian Plot: draws values against the section coordinate on rectangular axes.
Value Mode
- Normalized: scales values relative to the plotted maximum.
- Absolute: displays physical intensity values.
Grid Density
- 30 deg/25% Grid: shows a sparse angular and value grid.
- 10 deg/10% Grid: shows a denser grid for detailed reading.
Planar Sections
Planar Sections define C-plane style sections to plot. Numeric sections can be added, and an Imax section can track the plane through the maximum intensity direction.
Conic Sections
Conic Sections define gamma-style sections. These are useful for comparing intensity values around a cone of constant angle.