Color Plot
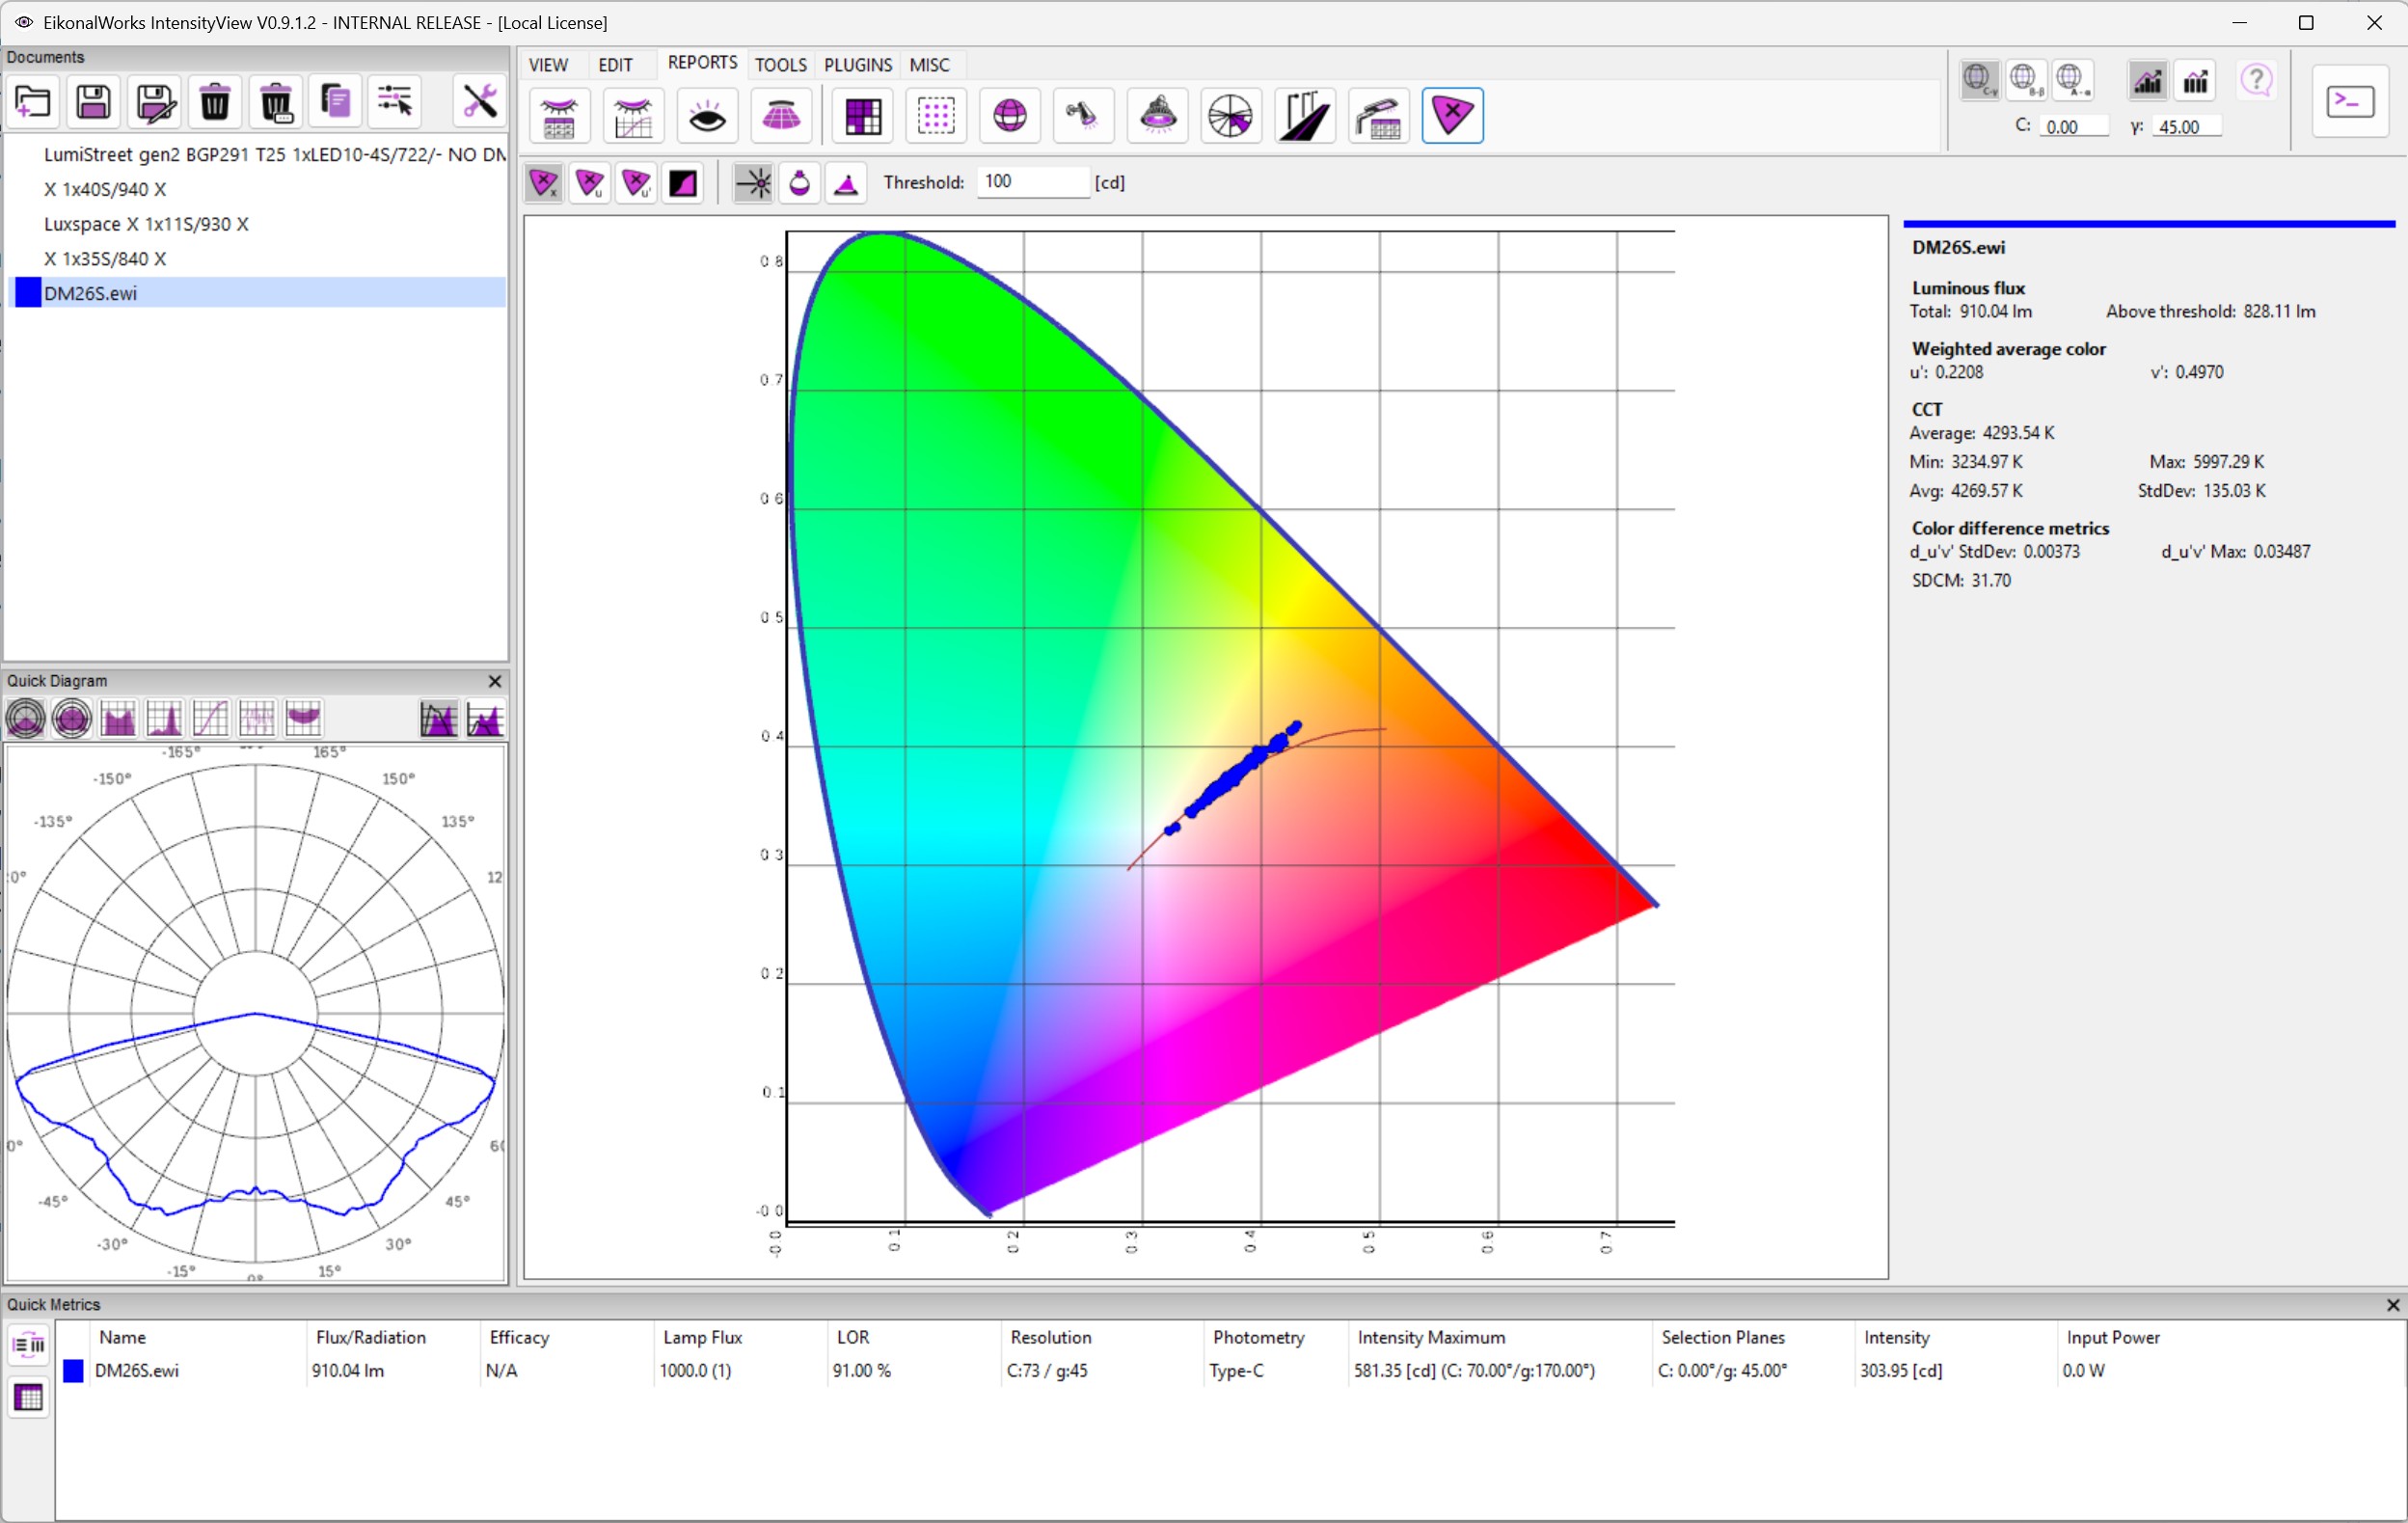
The Color Plot report displays color points from the measured or calculated photometric samples of the selected distributions. It is used to inspect chromaticity variation over the luminous intensity distribution.
Presentation Mode
- CIE 1931 xy: shows chromaticity in the standard xy diagram.
- CIE 1960 uv: shows the older uniform chromaticity scale.
- CIE 1976 u'v': shows the modern uniform chromaticity scale used for color difference checks.
- CIE Lab ab: shows color variation in Lab chromatic coordinates.
The right panel summarizes flux and color statistics for each selected photometry, including representative u'v', CCT, CCT spread, du'v' spread, and SDCM-style estimates when enough color data is available.
Threshold Filtering
- Minimum Intensity [cd]: includes samples whose luminous intensity is at least the entered candela value.
- Intensity Percentage [%]: includes samples whose intensity is at least the entered percentage of the maximum intensity.
- Minimum Illuminance [%]: converts each sample to illuminance on a plane perpendicular to nadir, then includes samples above the entered percentage of the maximum calculated illuminance.
At 0 percent, percentage filtering includes all valid samples. At 100 percent, only samples at the maximum value remain, within numeric tolerance. The flux above threshold is calculated from the filtered samples and accounts for photometric symmetry.
Practical Use
Use low thresholds to inspect total color consistency. Use high thresholds to focus on the visually dominant beam region. If a file contains only a single global color coordinate, the report shows that coordinate rather than a per-sample cloud.