EikonalWorks User's Manual
  • Workbench
  • IntensityView
Search Results for

    Show / Hide Table of Contents
    • Introduction
    • Installation and License Activation
    • User Interface
      • Keyboard Shortcuts
    • Supported File Formats
      • IES LM-63 Files
      • EULUMDAT Files
      • PHILLUM Files
      • EikonalWorks Intensity Files
      • IES TM-14 Files
      • IES TM-33 JSON Files
      • IES TM-33 XML Files
      • GLDF Files
    • View Modes
      • Sphere View
      • 3D View
      • 2D Map View
      • Table View
      • Illuminance View
      • Isocandela View
      • Polar And Cartesian Diagram View
      • Rendered Illuminance View
    • Edit Tools
      • Properties
      • Property Fields
      • Photometry Type And Resolution
      • Geometry Editor
      • Rotation
      • Symmetrize
      • Automatic Alignment
      • Smoothing And Denoising
      • Scale
      • Combine
      • Photometry Packaging Builder
    • Reports
      • UGR Table
      • UGR Chart
      • Soellner Diagram
      • Luminance Table
      • Utilization Factor Table
      • Uniformity Table
      • Zonal Lumen Table
      • Beam Spread
      • Luminaire Classification System
      • IES Roadway Report
      • Roadway Applicability
      • Color Plot
    • Tools
      • Photometry Modification Tool
      • Roadway Editor
      • Roadway Calculator
      • Roadway Generator
      • Roadway Optimizer
    • Plugins
      • LightTools Link
    • Miscellaneous
      • License Management

    Soellner Diagram

    Soellner Diagram

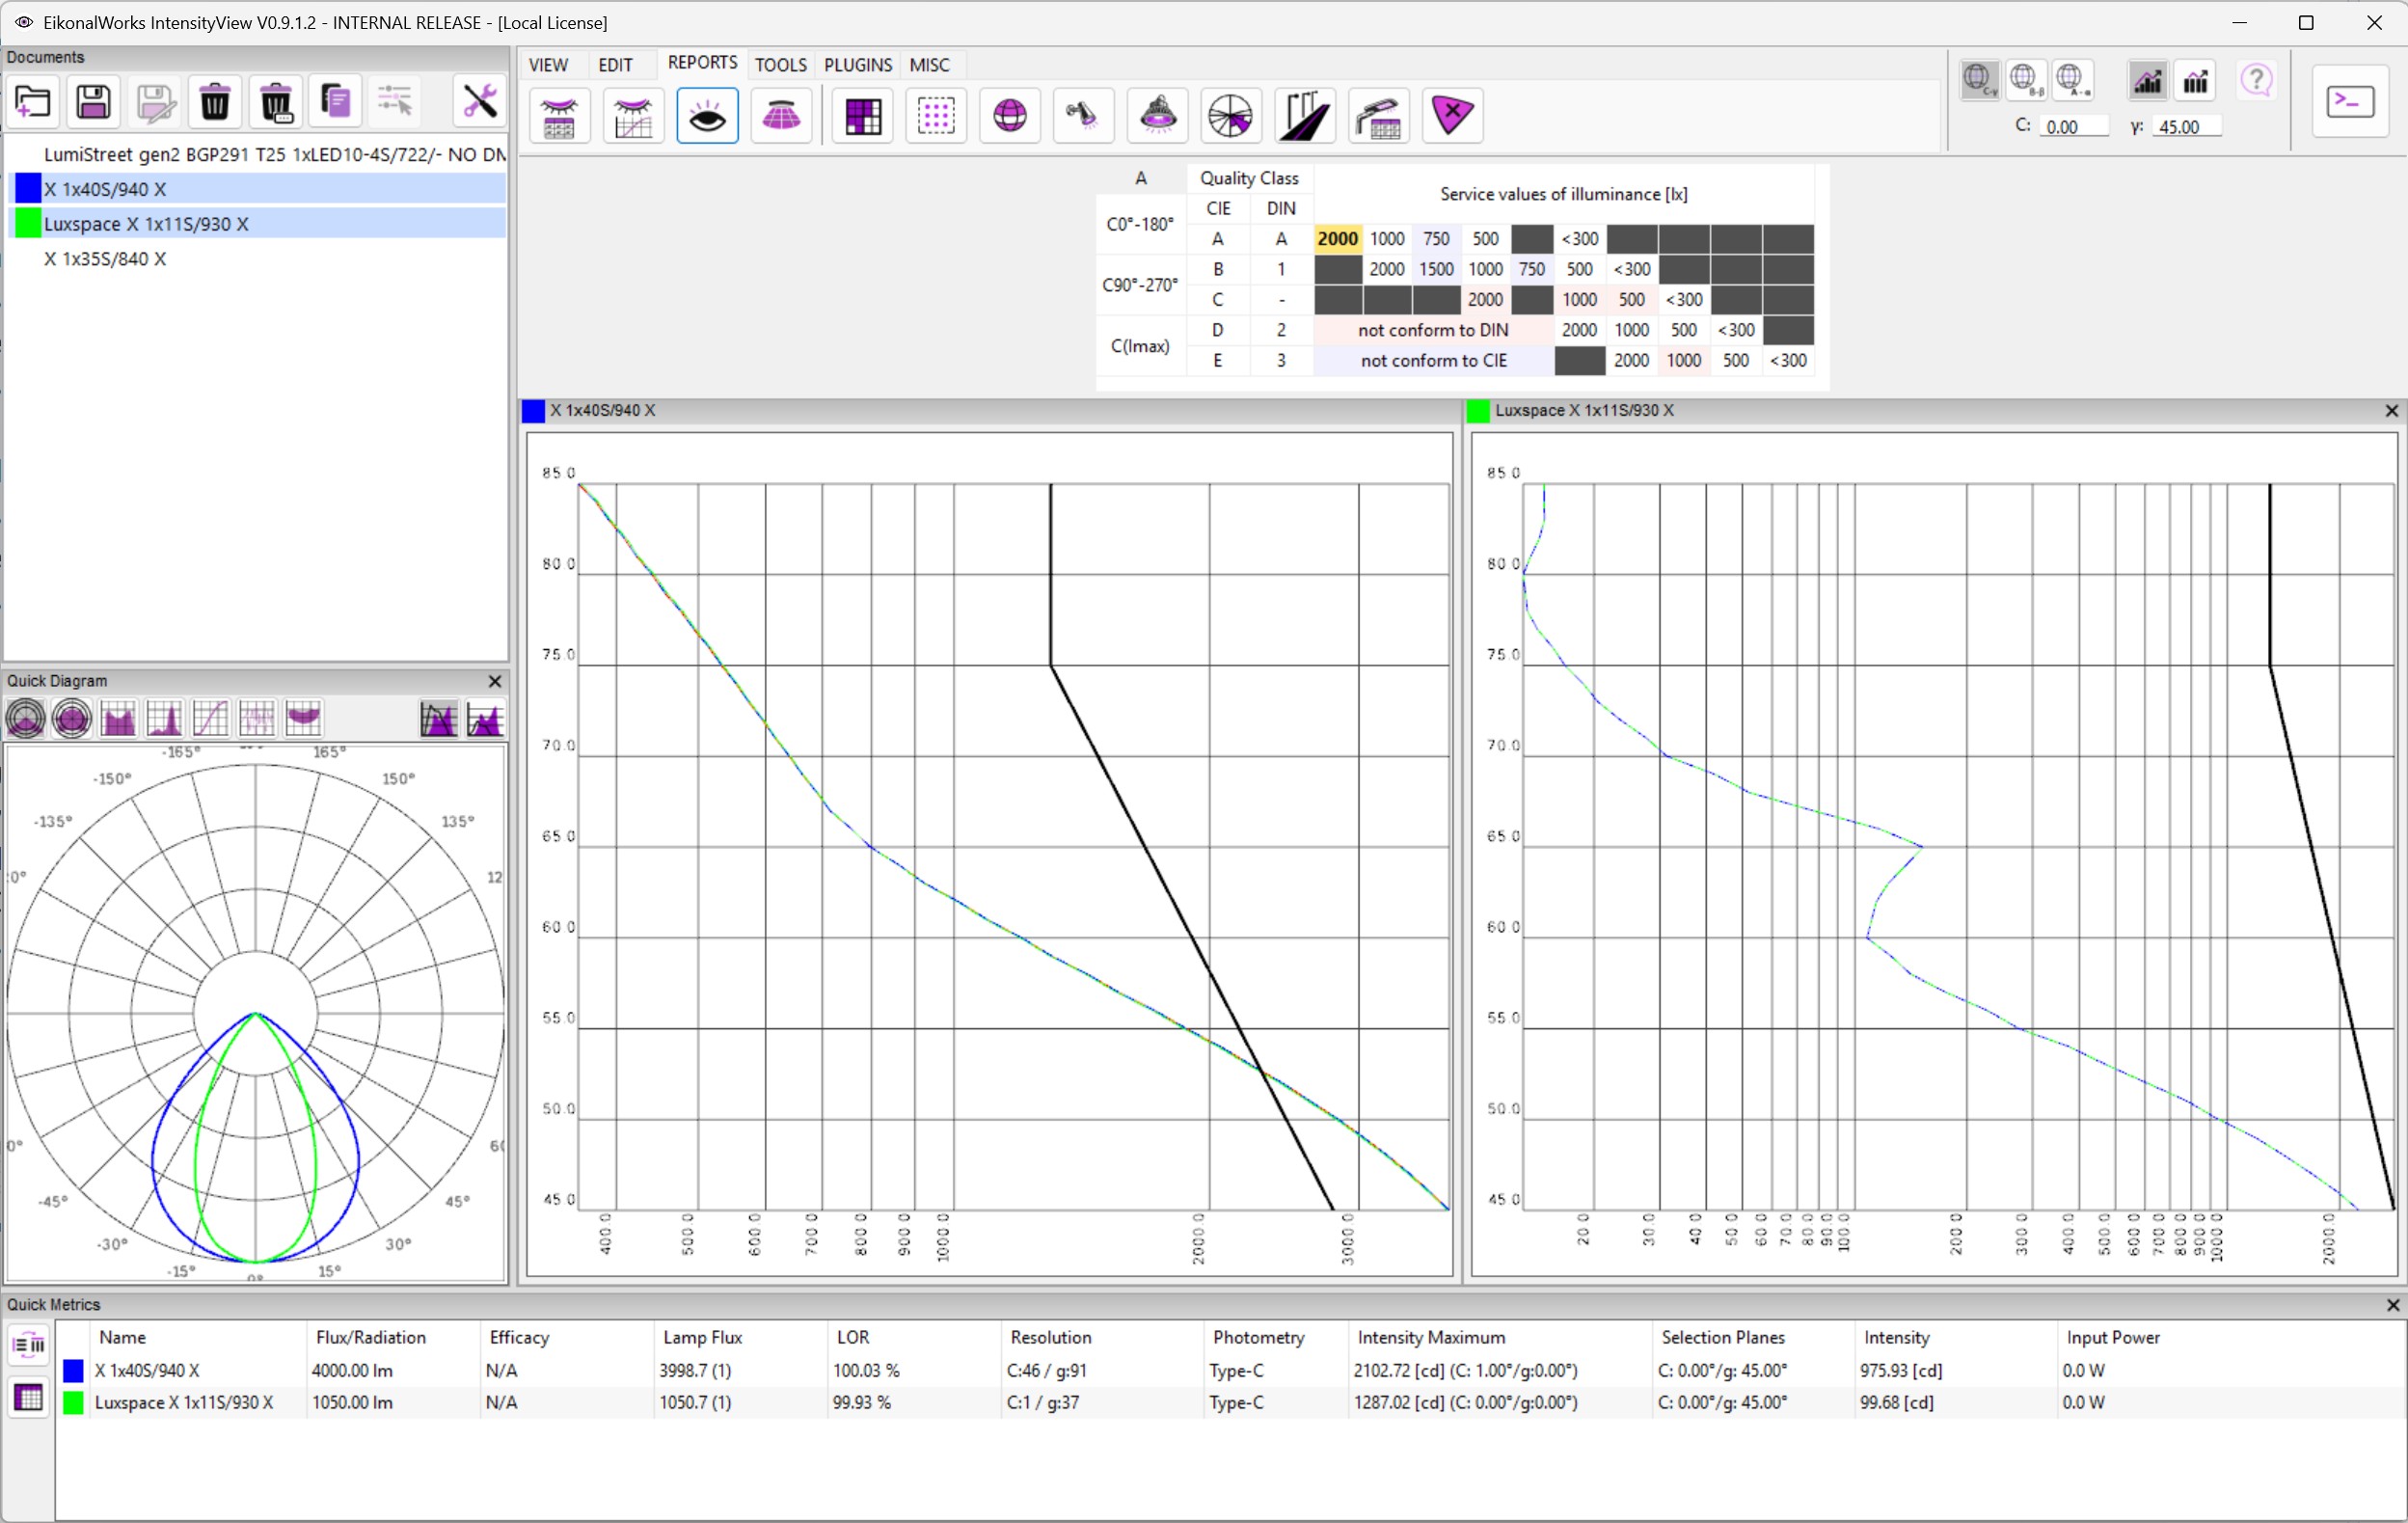
    The Soellner Diagram report presents glare limitation curves together with the selected luminaire luminance curve. The upper table selects the limit class. When a limit row is selected, the curve in the chart updates immediately.

    The chart is read in the same way as the UGR Chart: luminance is shown on the X axis, observation angle is shown on the Y axis, and the luminaire curve should remain to the left of the selected limit curve.

    Limit Selection

    Click a row in the upper limit table to switch the active limit. The selected limit represents the glare restriction to check. The plot below then shows whether the selected luminaire exceeds that limit for any observation angle.

    Practical Use

    Use this page when a project or market still specifies glare limitation by Soellner-style limit curves. If the luminaire curve is close to the selected limit, review the emitting geometry and flux assumptions before drawing a final conclusion.

    In this article
    Back to top Generated by DocFX