UGR Chart
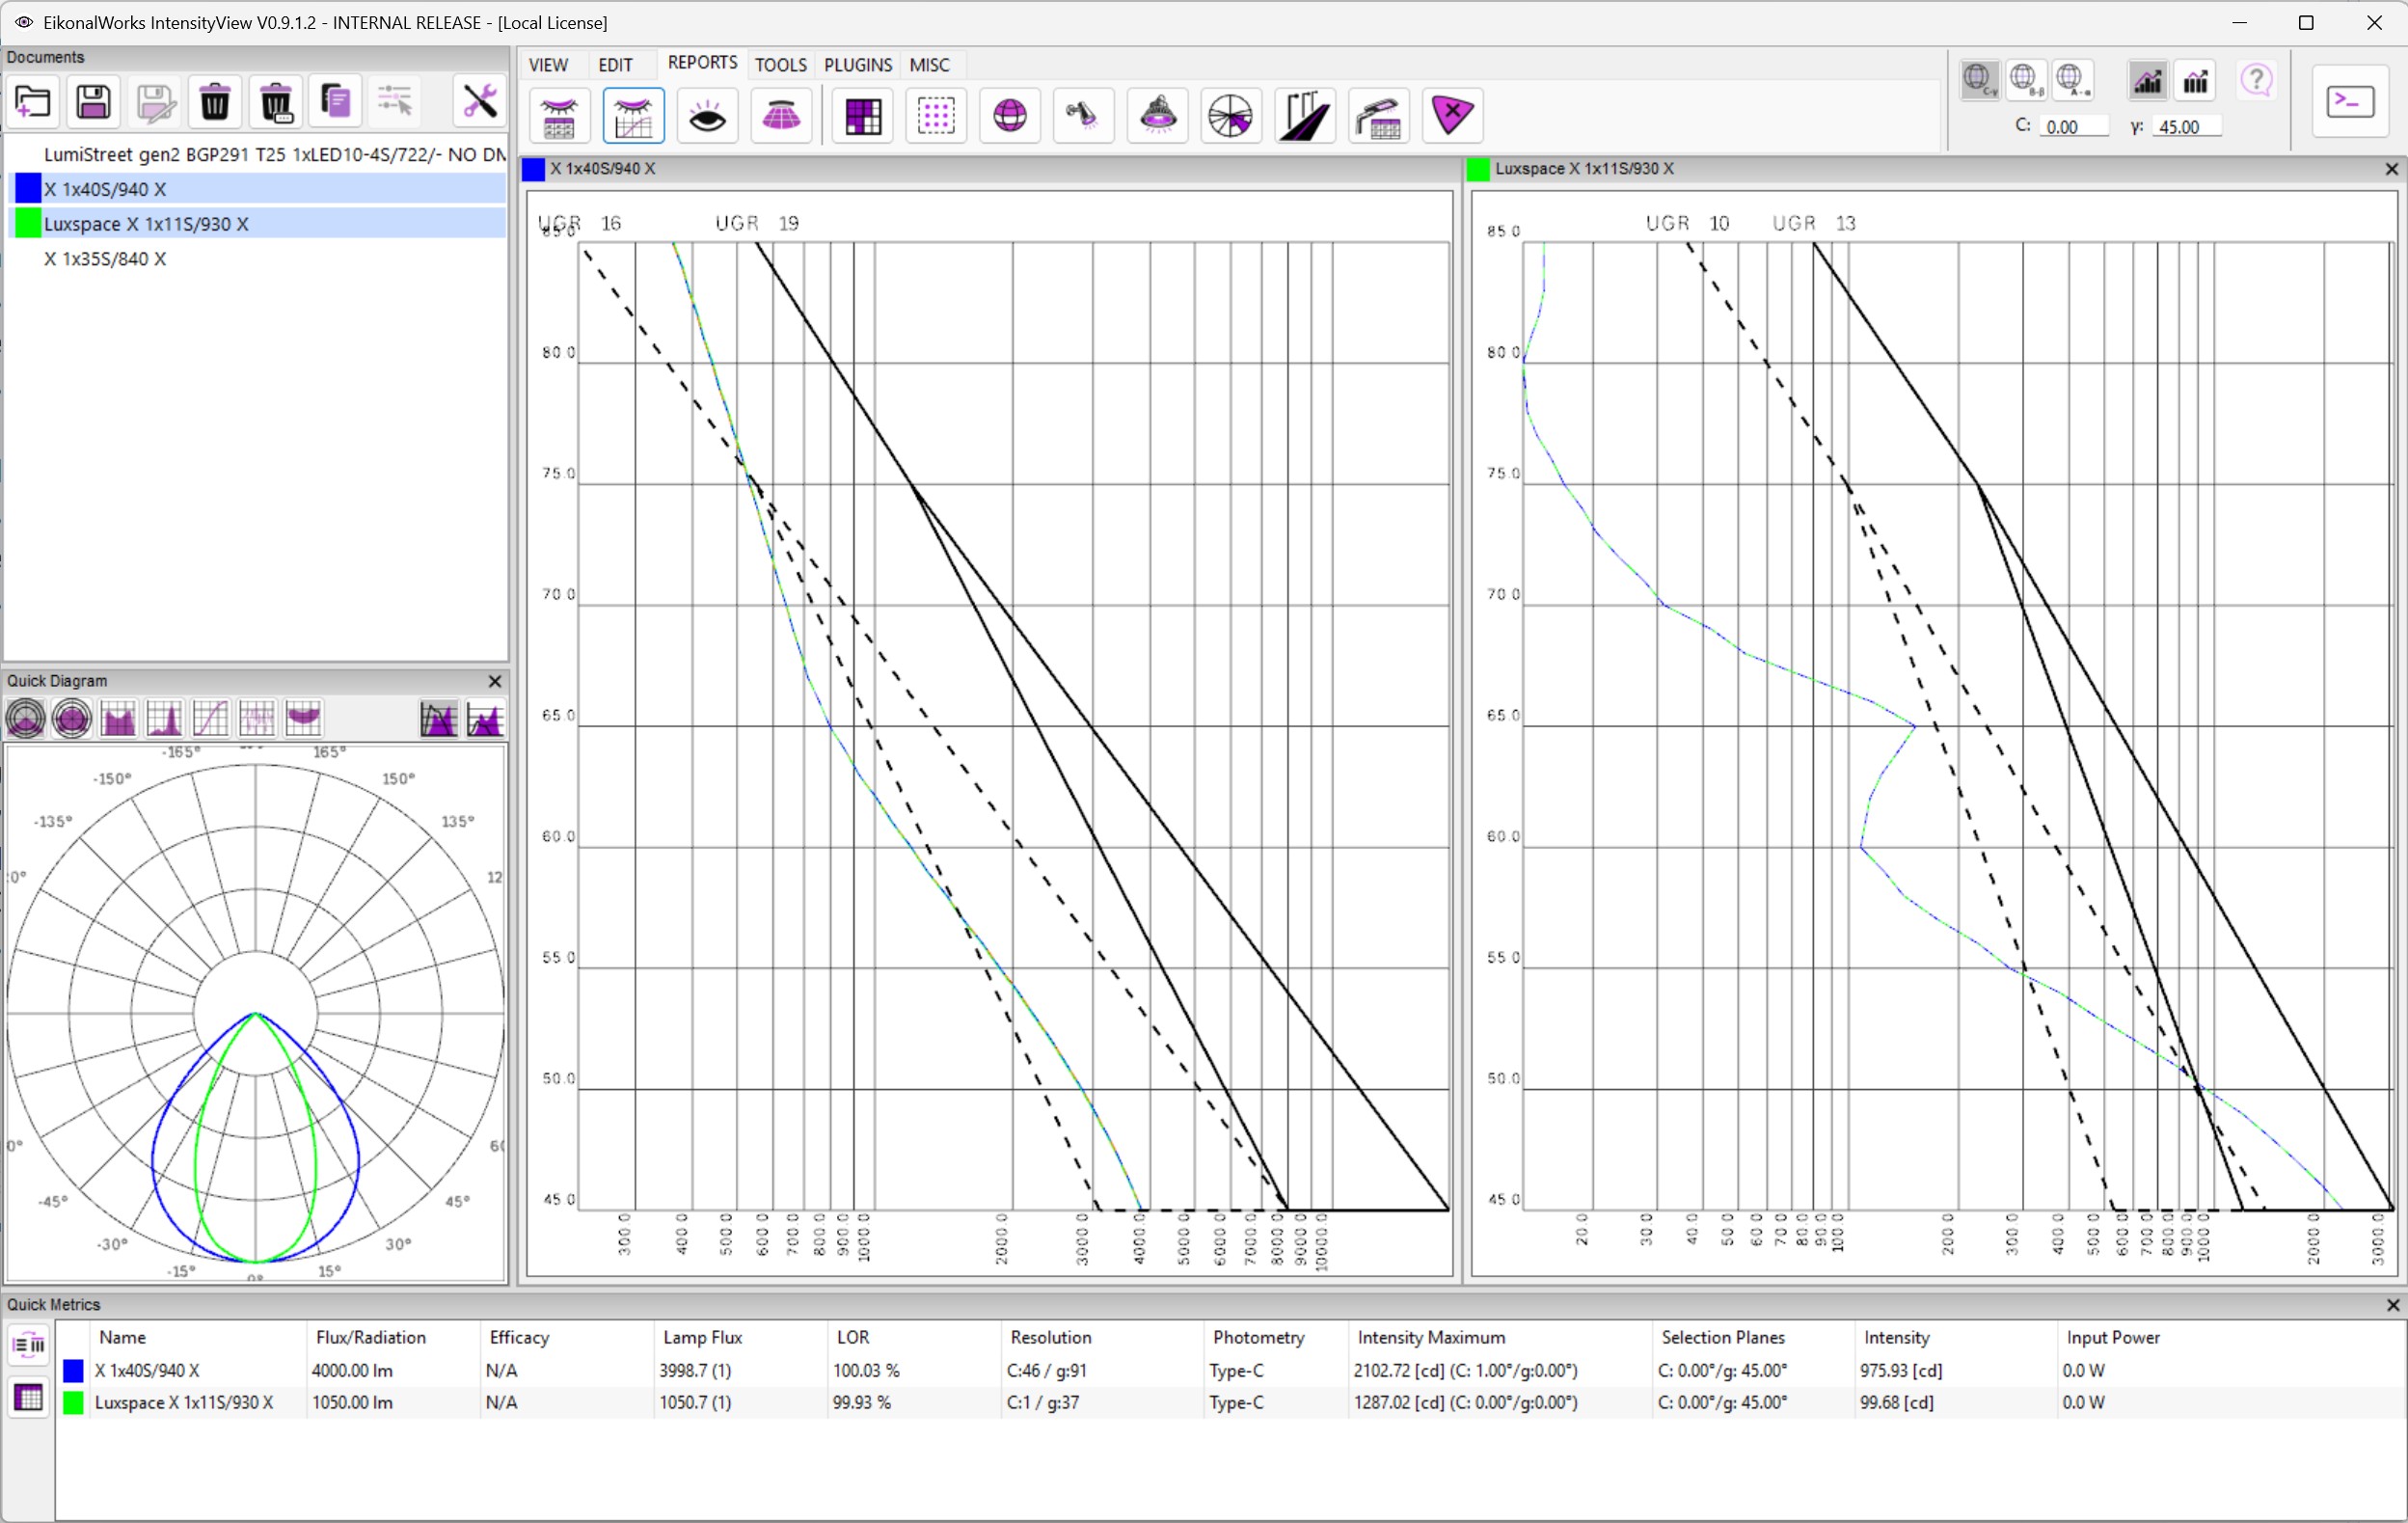
The UGR Chart report plots luminaire luminance against observation angle and overlays UGR limit curves. The X axis is luminance and the Y axis is observation angle.
A luminaire meets a selected limit when its luminance plot stays to the left of the corresponding limit curve. Points that cross to the right indicate observation angles where the apparent luminance is too high for that UGR limit.
The report uses the selected photometry and emitting geometry. If the luminous area is not defined realistically, the luminance curve can be misleading because luminance depends directly on apparent emitting area.
Reading The Chart
Use the chart to identify the angular range that controls glare. A narrow high-intensity peak may only affect a limited observation angle, while a broad bright source may sit close to the limit over a wide range. Compare the whole curve against the limit, not only the maximum value.
References
- IES definition of Unified Glare Rating: https://ies.org/definitions/unified-glare-rating-ugr/
- CIE 190:2010, Calculation and Presentation of Unified Glare Rating Tables: https://www.cie.co.at/publications/calculation-and-presentation-united-glare-rating-tables-indoor-lighting-luminaires