UGR Table
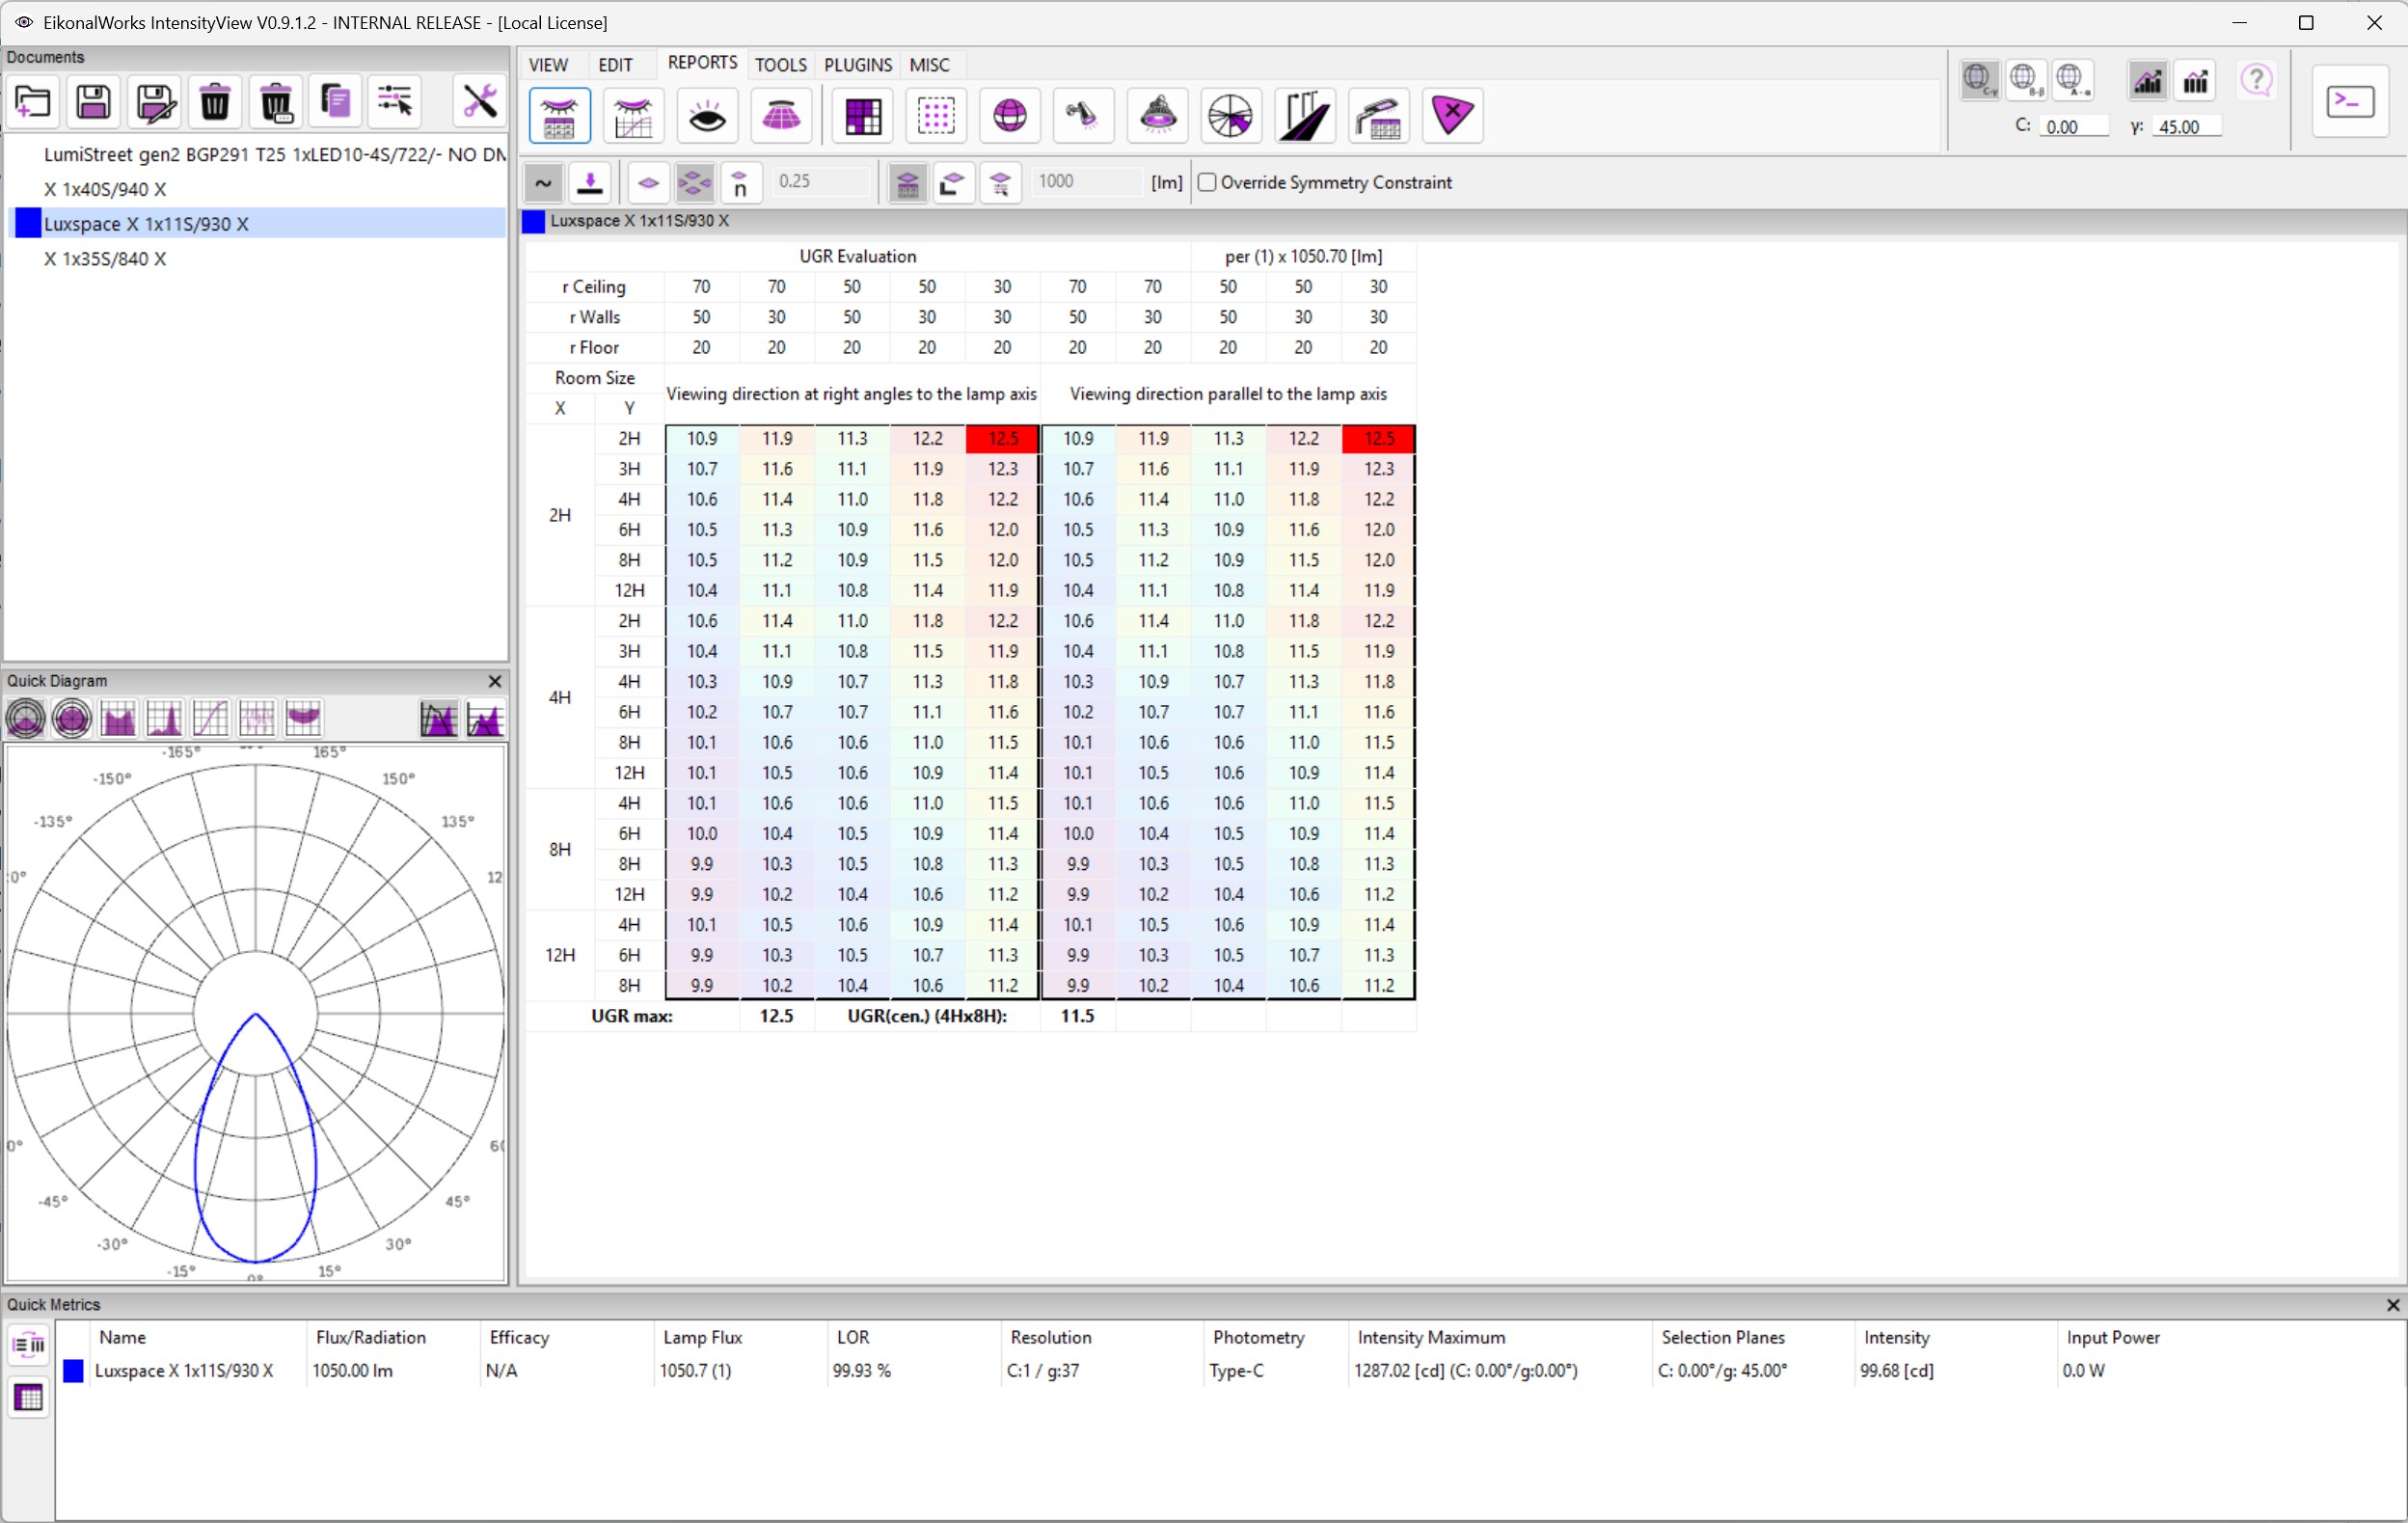
The UGR Table report evaluates discomfort glare from a luminaire in standardized rectangular room arrangements. It is intended for photometric analysis and luminaire comparison. It is not a substitute for evaluating every relevant observer position in a completed lighting installation.
Unified Glare Rating is expressed as
UGR = 8 log10[(0.25 / L_b) sum(L_s^2 omega / p^2)]
where:
L_sis the average luminance of a glare source in the direction of the observer, in cd/m2.omegais the solid angle subtended by that source at the observer.pis the Guth position index, which reduces the contribution of sources farther from the line of sight.L_bis the equivalent background luminance, in cd/m2.
The logarithm makes UGR sensitive to relative rather than absolute changes. Source luminance is squared, so the apparent emitting area and high-angle luminous intensity can strongly influence the result. A low UGR value indicates a lower predicted probability of discomfort glare under the stated conditions; it does not by itself describe disability glare, visual performance, or every subjective response to a real installation.
Standard Room Model
Both calculation modes use the same table geometry so their results can be compared directly.
- Room dimensions are expressed as multiples of
H, the vertical distance between the observer/reference plane and the luminaire plane. - Luminaires are placed on a regular rectangular grid at the selected spacing-to-height ratio.
- The observer is placed at the centre of the reference wall and looks horizontally into the room.
- The two five-column blocks represent viewing directions at right angles and parallel to the luminaire axis. The observer remains fixed; the photometric orientation of the luminaire is rotated by 90 degrees.
- Each row is evaluated for five ceiling / wall / floor reflectance combinations: 70/50/20, 70/30/20, 50/50/20, 50/30/20, and 30/30/20 percent.
The calculation uses a nominal H of 2 m and reports the standard room proportions as ratios such as 4H x 8H. The physical emitter dimensions remain part of the projected-area calculation.
For every visible luminaire, EW Intensity View samples the luminous intensity in the exact luminaire-to-observer direction. The apparent emitting area is obtained from the emitter geometry in that direction. In the small-source approximation:
L_s = I / A_p
omega approximately equals A_p / r^2
L_s^2 omega = I^2 / (A_p r^2)
Here I is luminous intensity, A_p is projected emitting area, and r is source distance. The resulting contribution is divided by p^2 before summation. Invalid geometry, non-finite values, zero flux, zero area, and near-zero vectors are rejected rather than propagated into the table.
CIE 190 Tabular Method
The CIE 190 mode follows the standardized table-production workflow described by CIE 190:2010. It is the appropriate mode for catalog data, comparison with conventional UGR tables, and assessment against requirements that explicitly refer to the tabular method.
The calculation proceeds as follows:
- The source term is evaluated for every luminaire in the standard array using luminous intensity, projected emitter area, distance, and Guth position index.
- The indirect vertical illuminance is estimated from the luminaire flux, light output ratio, downward zonal flux, room proportions, and the CIE wall-transfer factors for the selected reflectance set.
- The direct source term and equivalent background term are combined logarithmically to obtain one UGR value.
- The process is repeated for all room sizes, reflectance sets, and the two luminaire orientations.
The transfer-factor approach avoids explicitly sampling room surfaces. It is consequently fast and reproducible, and it remains the reference mode for standardized UGR presentation. Its assumptions are deliberate: one luminaire type, a rectangular room, a regular array, prescribed reflectances, and prescribed observer arrangements.
The tabular result should not be interpreted as a point calculation for an arbitrary real room. Research on real installations has shown that direct point-by-point UGR can be highly sensitive to small changes in observer position, especially for luminaires with sharp cut-off or elongated luminous areas. The standardized dense arrangement is intended to provide a robust, comparable rating rather than to reproduce every local variation.
Radiometric Method
The Radiometric Method retains the same UGR source equation and standard room arrangements, but replaces the tabulated background estimate with a numerical room-surface calculation. The term "radiometric" identifies the spatial integration method used by the software; the quantities entering UGR remain photometric quantities such as candela, lux, and luminance.
For each room and viewing orientation, the calculation performs these steps:
- The direct glare source factor is evaluated from the sampled luminous intensity distribution, projected emitter geometry, source distance, and Guth position index. The translated observer-facing source integral is normalized to one visible hemisphere.
- The ceiling, floor, and four walls are divided into finite surface elements. Sampling density adapts to surface size and is bounded between 6 x 6 and 24 x 24 samples per surface dimension.
- Direct illuminance at each surface element is calculated from every luminaire:
E = sum[I(theta, phi) cos(alpha) / r^2]
alpha is the incidence angle between the incoming ray and the inward surface normal.
- Each surface is treated as diffuse. Its first-reflection luminance is calculated from its reflectance and incident illuminance using
L = rho E / pi. - Reflected direct flux is accumulated over the enclosure. Further diffuse interreflection is estimated from total room area and area-weighted reflectance, with protection against reflectances approaching unity.
- Surface luminances are weighted by projected solid angle in the observer's forward field. This produces an equivalent background luminance
L_bfor each reflectance set. - The source factor and sampled
L_bare inserted into the UGR equation.
This method responds directly to the angular intensity distribution and to where emitted flux reaches the room surfaces. It can therefore differ from the CIE 190 table even though both modes use the same room and source geometry. Such a difference is expected: one method uses standardized transfer factors, while the other numerically estimates the luminous environment.
The radiometric calculation is an engineering estimate, not a full spectral renderer or a full radiosity solution. Surfaces are assumed Lambertian, one luminaire type is repeated in a regular array, and the room remains rectangular. Use it as a detailed comparison and sensitivity tool. Where a regulation or workplace requirement refers to tabular UGR, use the CIE 190 result as the compliance-oriented value.
Radiometric tables require substantially more work than CIE 190 tables. EW Intensity View reuses symmetry-equivalent photometric samples, reuses orientation-independent results for rotational distributions, and evaluates independent room rows concurrently. These optimizations do not reduce the surface sampling resolution. While the table is being refreshed, the report displays Calculation Running.
Spacing-To-Height Ratio
- Spacing : Height 1:1 uses
S/H = 1.0, the conventional CIE 190 table arrangement. - Spacing : Height 1:0.25 uses a dense array. Dense arrangements reduce sensitivity to the phase between observer and luminaire positions, but contain many more luminaires and take longer in Radiometric mode.
- Custom Spacing : Height Ratio accepts a finite positive ratio. Smaller values produce denser arrays; larger values produce wider spacing.
The 2019 CIE conference study linked below discusses why dense luminaire arrangements and averaging inside the logarithmic UGR expression provide more stable results than averaging already-calculated UGR values.
Luminous Flux Mode
- Corrected UGR Table evaluates the luminaire at its current luminous flux.
- Uncorrected UGR Table evaluates the standard 1000 lm table condition.
- Custom Luminous Flux evaluates the same normalized intensity distribution at the entered positive luminous flux.
Changing luminous flux changes source luminance and background luminance. Because the source luminance appears squared while background luminance is linear, the final UGR value is not invariant with luminous flux.
Symmetry Requirement
Standard UGR tables require a distribution suitable for the two prescribed orientations. EW Intensity View normally accepts quadratic or rotational symmetry. Override Symmetry Constraint permits calculation for other distributions, but the resulting table no longer satisfies the normal symmetry assumption and should be identified accordingly in exported work.
Emitter geometry symmetry also matters. Rotational photometry does not automatically make a rectangular or otherwise directional emitting surface rotational. The direct term therefore continues to evaluate projected emitter area independently for both viewing orientations.
Reading The Table
Select the room row and reflectance column that best represent the intended comparison. The two orientation blocks should both be checked unless luminaire orientation is fixed by the project.
UGR max is the largest finite value in the displayed table. UGR(cen.) (4Hx8H) reports the largest value for the 4H x 8H reference room. Values are displayed to one decimal place, but calculations retain full floating-point precision until presentation.
Published limiting values are tied to defined application standards and to the tabular method. A result such as UGR 19 should therefore be read together with the applicable standard, room assumptions, luminaire arrangement, luminous flux, and calculation mode. Small numerical differences between software packages can arise from source-area interpretation, interpolation, observer placement, flux normalization, and rounding.
Limitations Of Average-Source UGR
Classical UGR uses average source luminance. Luminaires with exposed LEDs or strongly non-uniform luminous areas may produce discomfort that is not represented adequately by the average. CIE 232:2019 specifically reviews this limitation and methods based on a more precise definition of glare-source area. Accurate emitter geometry is therefore important, but geometry alone cannot fully characterize every non-uniform source.
UGR is a model of discomfort glare under photopic indoor conditions. It should be supplemented by project-specific checks where observer positions, mixed luminaire types, windows, reflections, very small high-luminance elements, or unusual room geometries are important.
References
- CIE 117:1995, Discomfort Glare in Interior Lighting
- CIE 190:2010, Calculation and Presentation of Unified Glare Rating Tables for Indoor Lighting Luminaires
- CIE 232:2019, Discomfort Caused by Glare from Luminaires with a Non-Uniform Source Luminance
- Vissenberg et al., Robust Unified Glare Rating Evaluation for Real Lighting Installations, CIE x046:2019, DOI 10.25039/x46.2019.PO150