EikonalWorks User's Manual
  • Workbench
  • IntensityView
Search Results for

    Show / Hide Table of Contents
    • Introduction
    • Installation and License Activation
    • User Interface
      • Keyboard Shortcuts
    • Supported File Formats
      • IES LM-63 Files
      • EULUMDAT Files
      • PHILLUM Files
      • EikonalWorks Intensity Files
      • IES TM-14 Files
      • IES TM-33 JSON Files
      • IES TM-33 XML Files
      • GLDF Files
    • View Modes
      • Sphere View
      • 3D View
      • 2D Map View
      • Table View
      • Illuminance View
      • Isocandela View
      • Polar And Cartesian Diagram View
      • Rendered Illuminance View
    • Edit Tools
      • Properties
      • Property Fields
      • Photometry Type And Resolution
      • Geometry Editor
      • Rotation
      • Symmetrize
      • Automatic Alignment
      • Smoothing And Denoising
      • Scale
      • Combine
      • Photometry Packaging Builder
    • Reports
      • UGR Table
      • UGR Chart
      • Soellner Diagram
      • Luminance Table
      • Utilization Factor Table
      • Uniformity Table
      • Zonal Lumen Table
      • Beam Spread
      • Luminaire Classification System
      • IES Roadway Report
      • Roadway Applicability
      • Color Plot
    • Tools
      • Photometry Modification Tool
      • Roadway Editor
      • Roadway Calculator
      • Roadway Generator
      • Roadway Optimizer
    • Plugins
      • LightTools Link
    • Miscellaneous
      • License Management

    Zonal Lumen Table

    Zonal Lumen Table

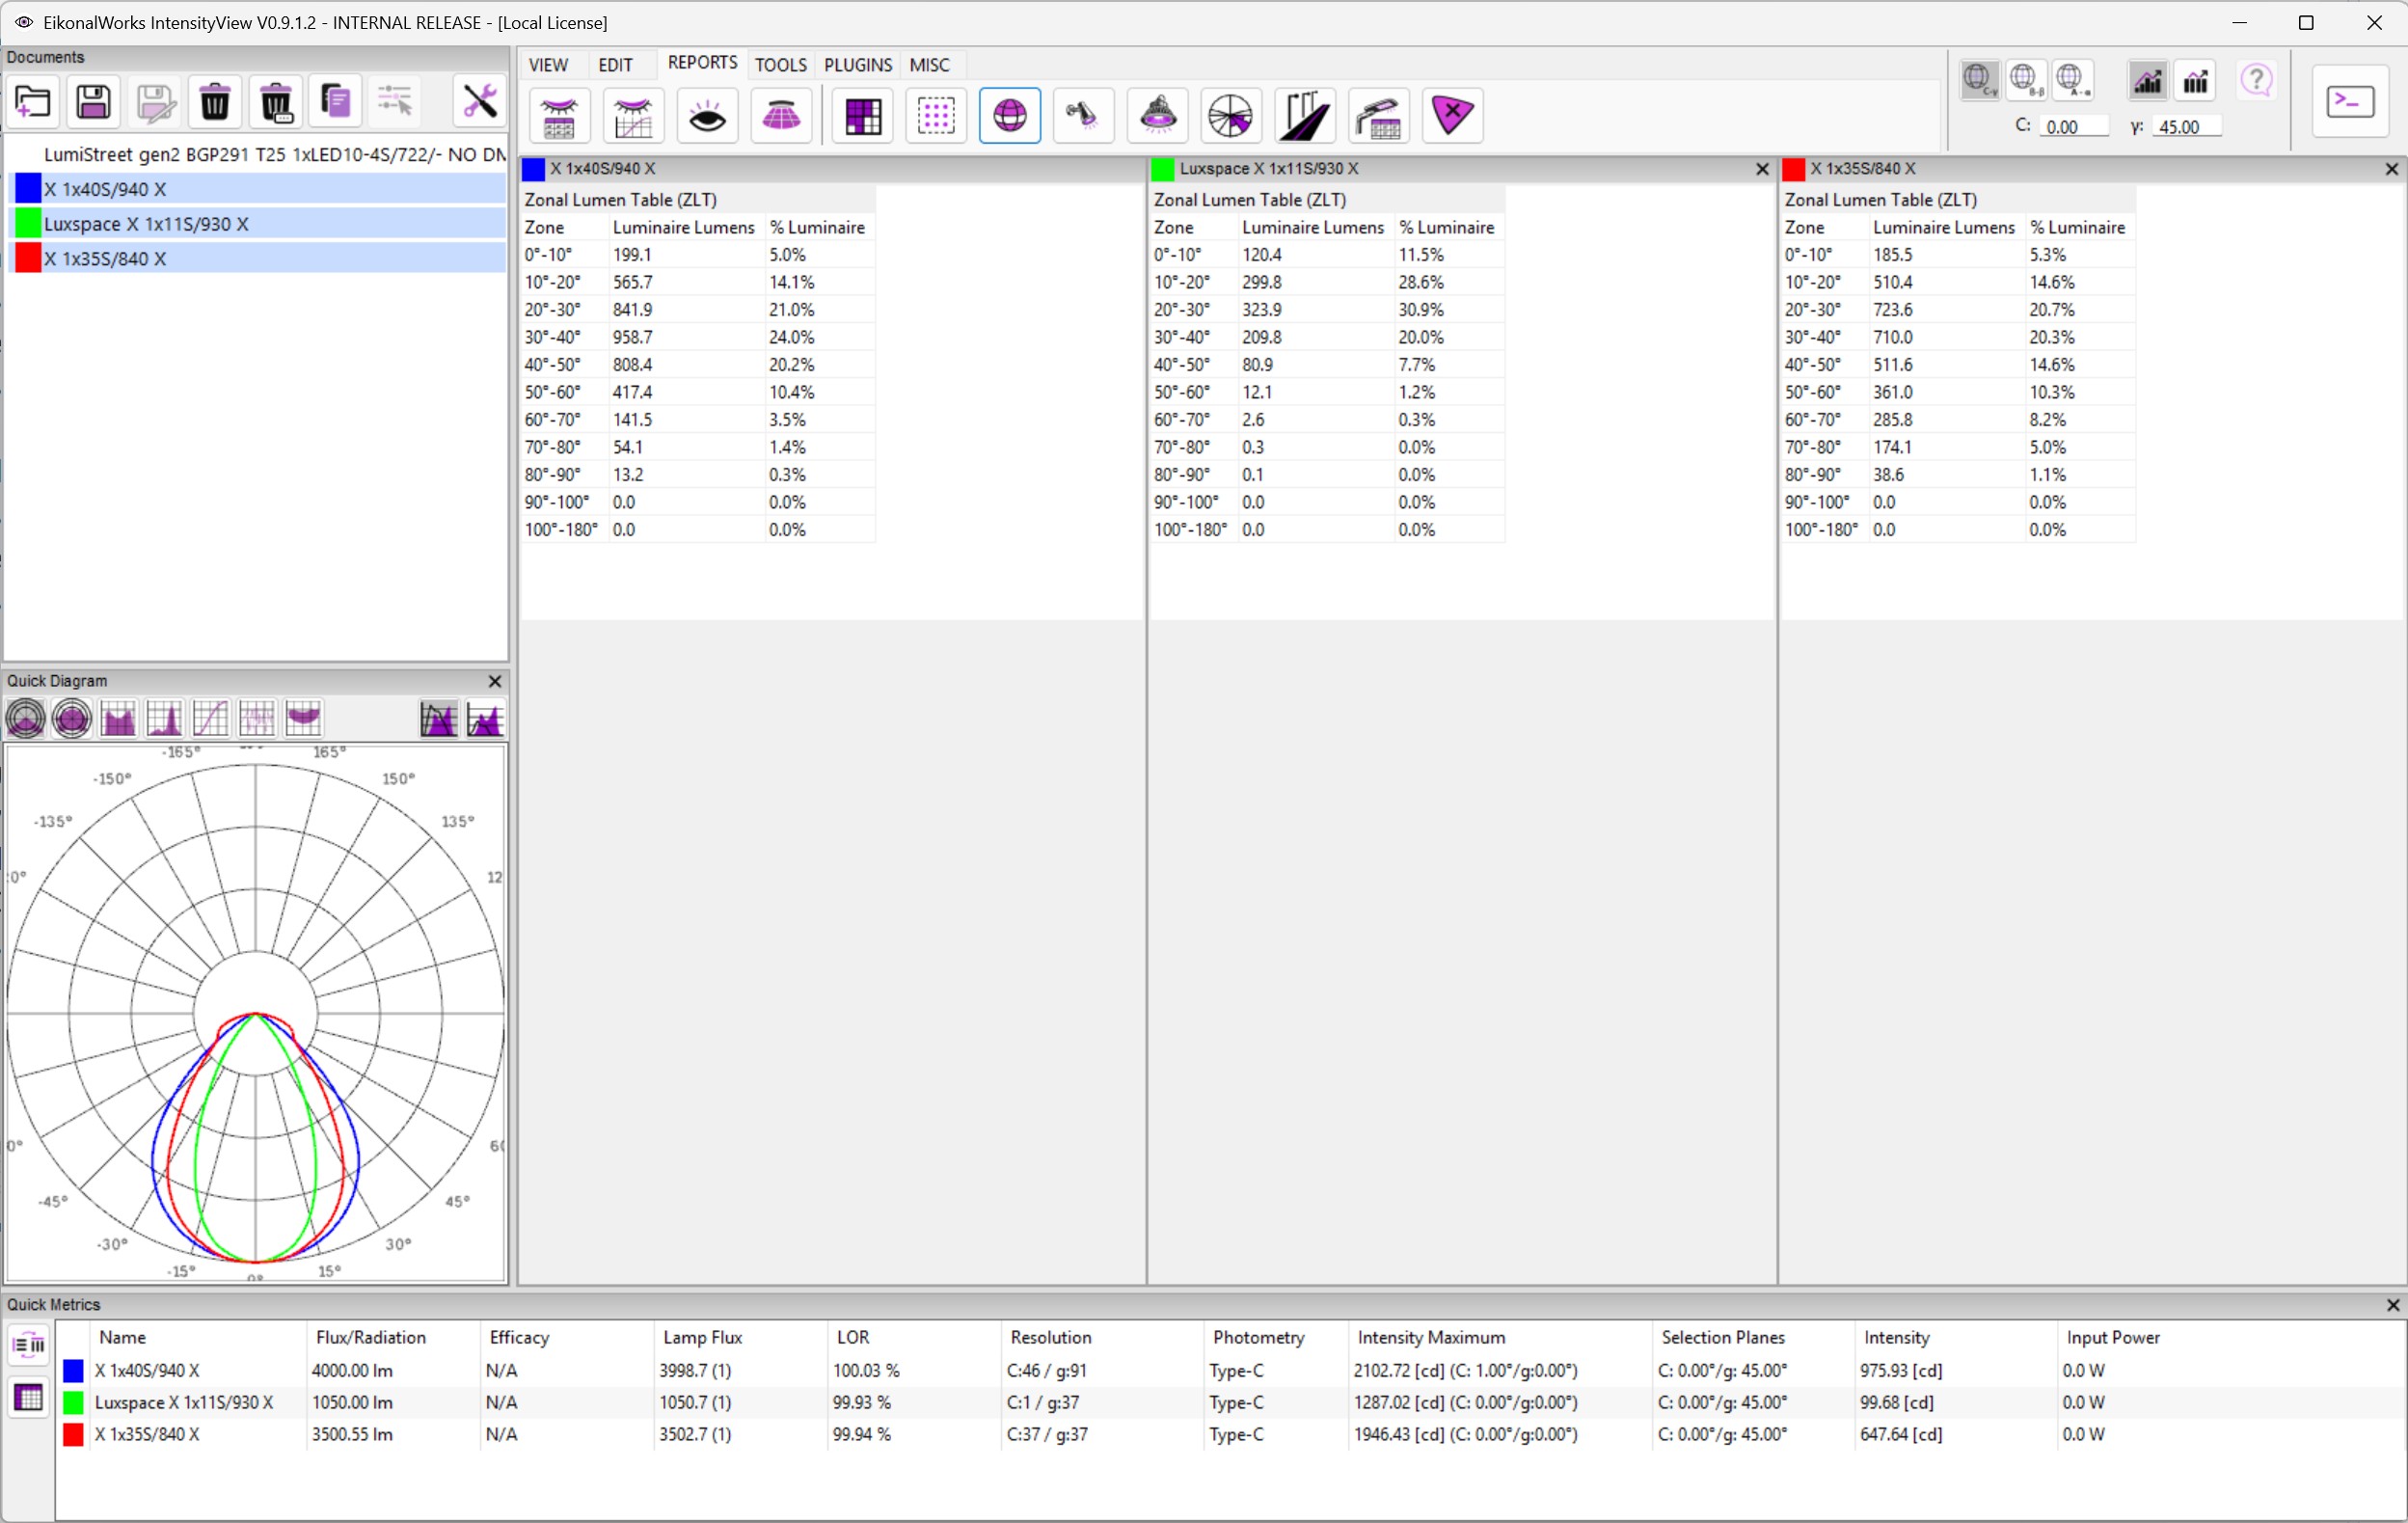
    The Zonal Lumen Table summarizes how much luminous flux is emitted into angular zones. A zone is a band of directions, commonly grouped by gamma angle or by upper and lower hemispheres.

    The report integrates luminous intensity over solid angle. Each cell is a lumen contribution from the selected angular band, so the table shows where the luminaire sends its flux rather than only where the peak intensity occurs.

    Reading The Table

    Large values in low gamma zones indicate forward/downward concentration near nadir. Large values at high gamma angles indicate wide or upward distribution. Compare zones when checking uplight, glare risk, roadway distribution shape, or general beam spread.

    Practical Use

    Use the Zonal Lumen Table to understand the energy balance of a photometry. It is useful together with the polar view: the polar plot shows the shape, while the zonal table shows how much flux is assigned to each angular region.

    In this article
    Back to top Generated by DocFX